FIGURE 6.
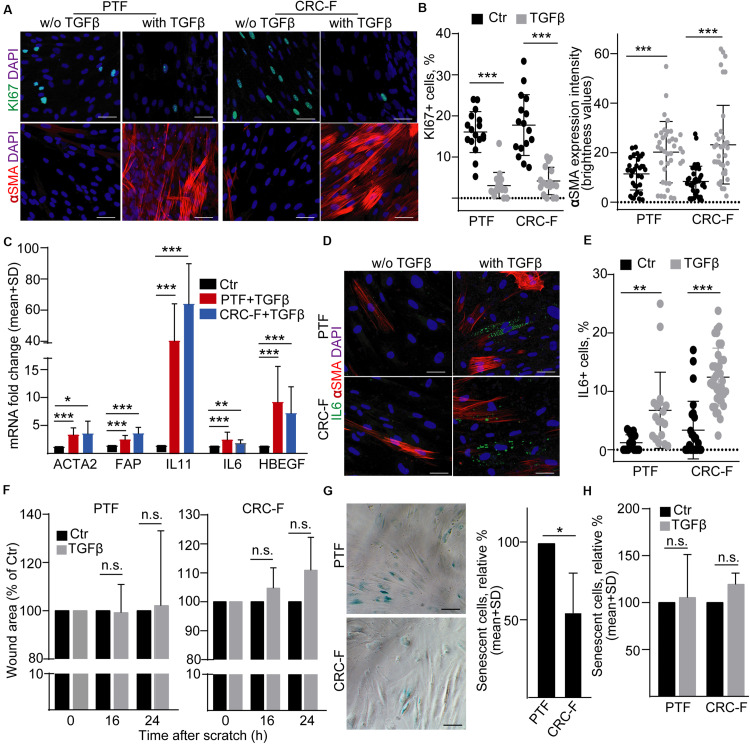
TGFβ activates PTFs and CRC-Fs. (A,B) αSMA and KI67 immunostaining in control and TGFβ-treated (4 days) PTFs or CRC-Fs (confocal microscopy; A) and their quantification (B). αSMA expression intensity was determined by the ImageJ software. (C) Fold change of the indicated mRNAs in TGFβ-treated fibroblasts compared to untreated controls (RT-qPCR, n = 4). Note that pairwise comparisons were carried out between control and treated samples. (D) IL-6 and αSMA detection in PTFs and CRC-Fs (confocal microscopy). (E) The proportion of IL-6+ cells with the indicated treatments (quantification of confocal microscopy images). (F) Relative wound area of the TGFβ-treated fibroblasts compared to the control confluent fibroblast cultures (n = 3). (G–H) The proportion of cells with SA-β-galactosidase activity. Representative microscopic images (G) and their quantification (G-H, n = 3, paired samples). Mann–Whitney U-test (B,E) or paired t-test (C,F,G,H) were used with *p < 0.05, **p < 0.01, and ***p < 0.005. Scale bars: 50 μm (D,G).

