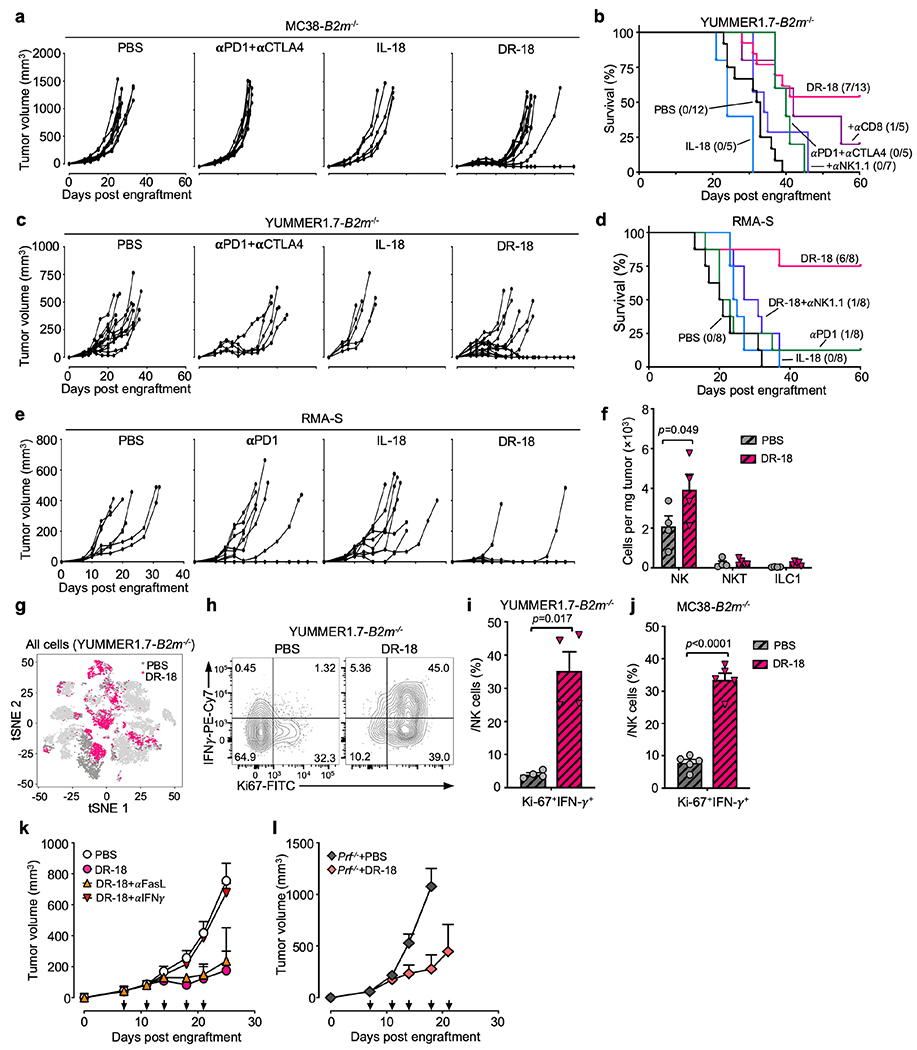
Extended Data Figure 9. Related to Fig. 4. DR-18 is effective towards MHC Class I deficient tumors.
(a) Representative spider plots showing tumor growth in WT mice s.c. engrafted with MC38-B2m−/− tumors treated with PBS, anti-PD-1+anti-CTLA-4, or IL-18 or DR-18. (b) Kaplan-Meier survival curves and (c) representative spider plots of WT mice s.c. engrafted with YUMMER1.7-B2m−/− tumors treated twice weekly with PBS, anti-PD-1+anti-CTLA-4, IL-18, DR-18, or DR-18 plus anti-CD8 and anti-NK1.1 antibodies. Depleting antibodies were given the same schedule as MC38-B2m−/− (see methods). (d) Kaplan-Meier survival curves and (e) spider plots showing tumor growth of WT mice s.c. engrafted with 1×10⁶ RMA-S tumor cells and treated with PBS, anti-PD-1, IL-18, DR-18 or DR-18+ anti-NK1.1. Spider plot. (a-e) Data is representative of 2 independent experiments and survival curve data are pooled from 2 independent experiments. (f) Absolute cell number of intratumoral NK cells (NK1.1+CD3−Eomes+DX5+CD200R−), NKT cells (NK1.1+CD3+) and ILC1 cells (NK1.1+CD3−Eomes−DX5−CD200R+) in WT mice s.c engrafted with MC38-B2m−/− tumors in indicated treatment groups. (g) t-SNE projection of different clusters in YUMMER1.7-B2m−/− tumors as a function of treatment. YUMMER1.7 tumors are shown in light grey (discussed in Fig. 3, see methods). (h) Representative flow cytometry plots of IFNγ and Ki67 staining on intratumoral NK cells from YUMMER1.7-B2m−/− tumors treated with PBS or DR-18. (i,j) Frequency of Ki67+IFNγ+ NK cells from YUMMER1.7-B2m−/− (i) and MC38-B2m−/− (j) tumors treated with PBS or DR-18. (k) Representative mean tumor growth of WT mice s.c. engrafted with MC38-B2m−/− tumors and treated with PBS, DR-18, or DR-18 plus anti-FasL or anti-IFN-γ. (l) Representative mean tumor growth of Perforin−/− mice s.c. engrafted with MC38-B2m−/− tumors and treated with PBS (n=3) and DR-18 (n=5) as indicated. (h-l) Data are representative of 2 independent experiments with 5 mice per group. P values were calculated using two-tailed unpaired Student’s t-test, and data are presented as the mean ± SEM.

