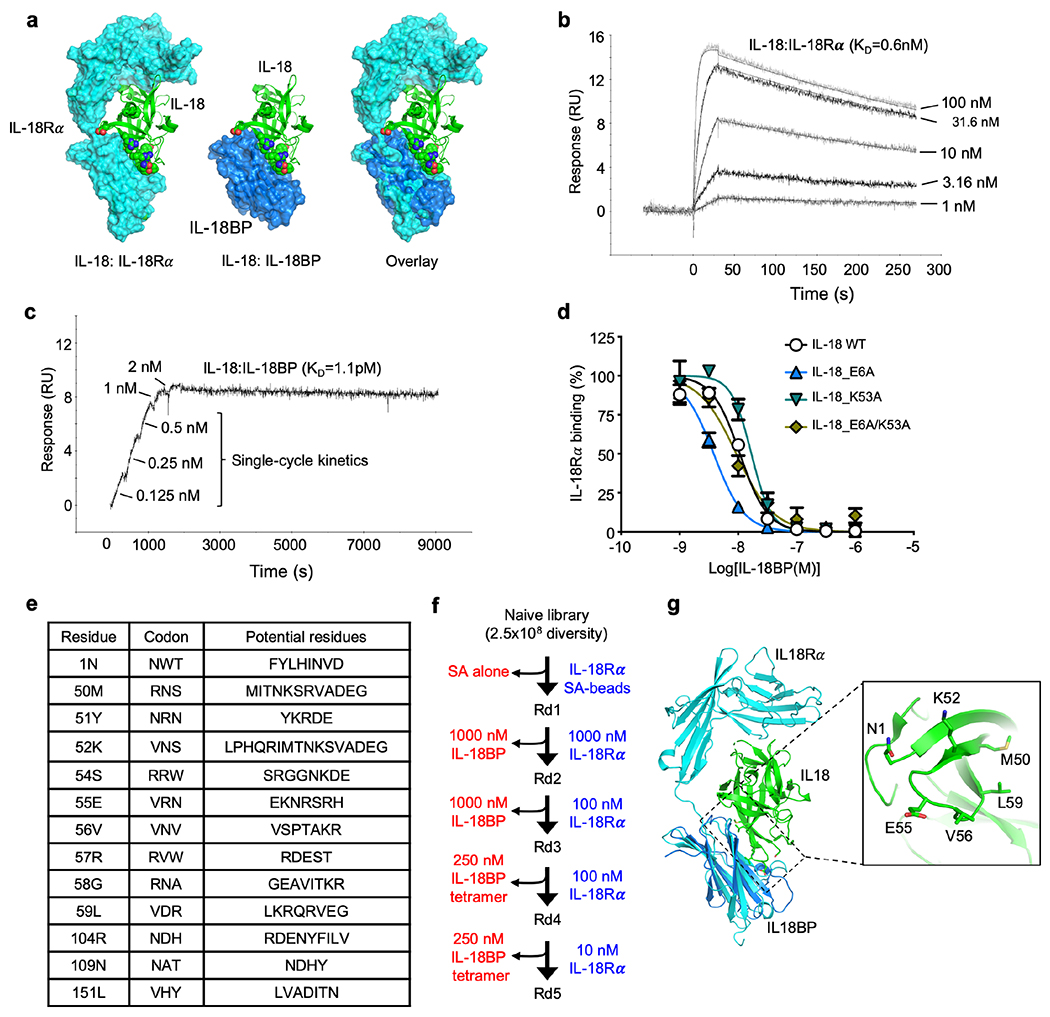
Extended Data Figure 3. Related to Figure 1. Generation of Decoy-Resistant IL-18.
(a) Structural alignment of hIL-18 (green): hIL-18Rα/Rβ (cyan) complex (PDB ID 3WO4) with hIL-18: vIL-18BP (blue) complex (PDB ID 3F62). (b-c) Representative surface plasmon resonance (SPR) sensorgrams of murine WT IL-18 (b) binding to IL-18Rα or IL-18BP (c). IL-18Rα measurements were conducted using a conventional multiple cycle program, whereas IL-18BP measurements were conducted using a single-cycle program. (d) Dose-response curves of IL-18BP protein antagonizing IL-18Rα in complex with indicated IL-18 and mutants (E42A, K89A & E42A/K89A). Experiments were performed in duplicates (n=2). (e) Table showing randomized positions of murine IL-18 to create DR_18, with the corresponding degenerate codon and the potential amino acid at each position. (f) Summary of the experimental design for directed evolution and yeast selection process to generate DR-18. Yeast libraries were selected for IL-18Rα binding and counter selected against IL-18BP using MACS (Round 1 & 2) and subsequently FACS (Round 3, 4 & 5). Blue text (right side) indicates positive selection reagent, and red text (left side) shows the counter-selection reagent. (g) Structural representation of DR-18 mutation positions in IL-18Rα and IL-1BP binding overlap region. Side chains from a minimized set of mutations up to 6 consensus residues (1N, 50M, 52K, 55E, 56V and 59L) are displayed as stick models. (b-d) Data is representative of 2 independent experiments, and data are presented as the mean ± SEM.

