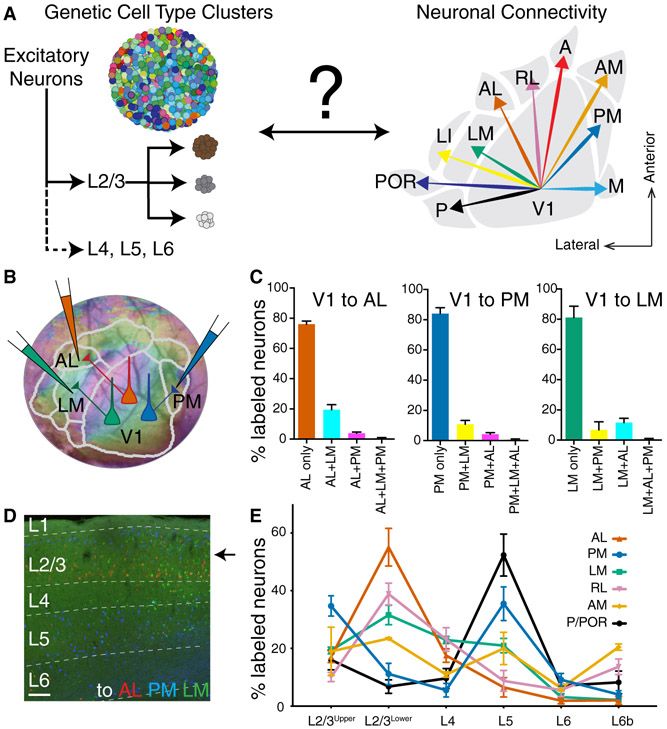
Figure 1. Anatomical Diversity of Cortico-Cortical Projection Neurons in Mouse Primary Visual Cortex.
(A) Schematic of genetic cell types defined by gene expression difference clusters (left) versus anatomical cell types based on long-distance connectivity patterns to higher visual areas (HVAs) in V1 (right). Cartoons describing genetic cell type clusters were adapted and modified from (Poulin et al., 2016). (B) Single neuron retrograde labeling strategy using three different colors of cholera toxin subunit b tracer injections on AL, PM, and LM after area border determination using intrinsic signal imaging. (C) A fraction of V1 neurons projecting to single, double, and triple areas in each case when they have the projections to AL, PM, or LM, respectively. A total of 12791 (V1→AL), 8084 (V1→PM), 2344 (V1→LM) retrogradely labeled neurons were counted per animal (n=3). (D) A coronal section of V1 displaying neurons projecting to AL (red), PM (blue), LM (green) across different cortical layers. (E) Soma locations of V1 neurons are distributed with distinctive laminar patterns depending on their HVA projections (mean ± SEM). Total 55742 retrograde labeled neurons were analyzed in 12 mice. Two-way ANOVA determined that fractions of V1 neurons projecting to HVAs are significantly different between their projection target areas and soma laminar locations (p<0.0001). Tukey’s multiple comparisons tested the significant difference of V1 neuron fraction between projection areas within each layer (Figure S1B and Table S2). Scale bar in panel D, 100μm. A, anterior; AL, anterolateral; AM, anteromedial; LI, interomediolateral; LM, lateromedial; M, medial; P, posterior; PM, posteromedial; POR, postrhinal; RL, rostrolateral.

