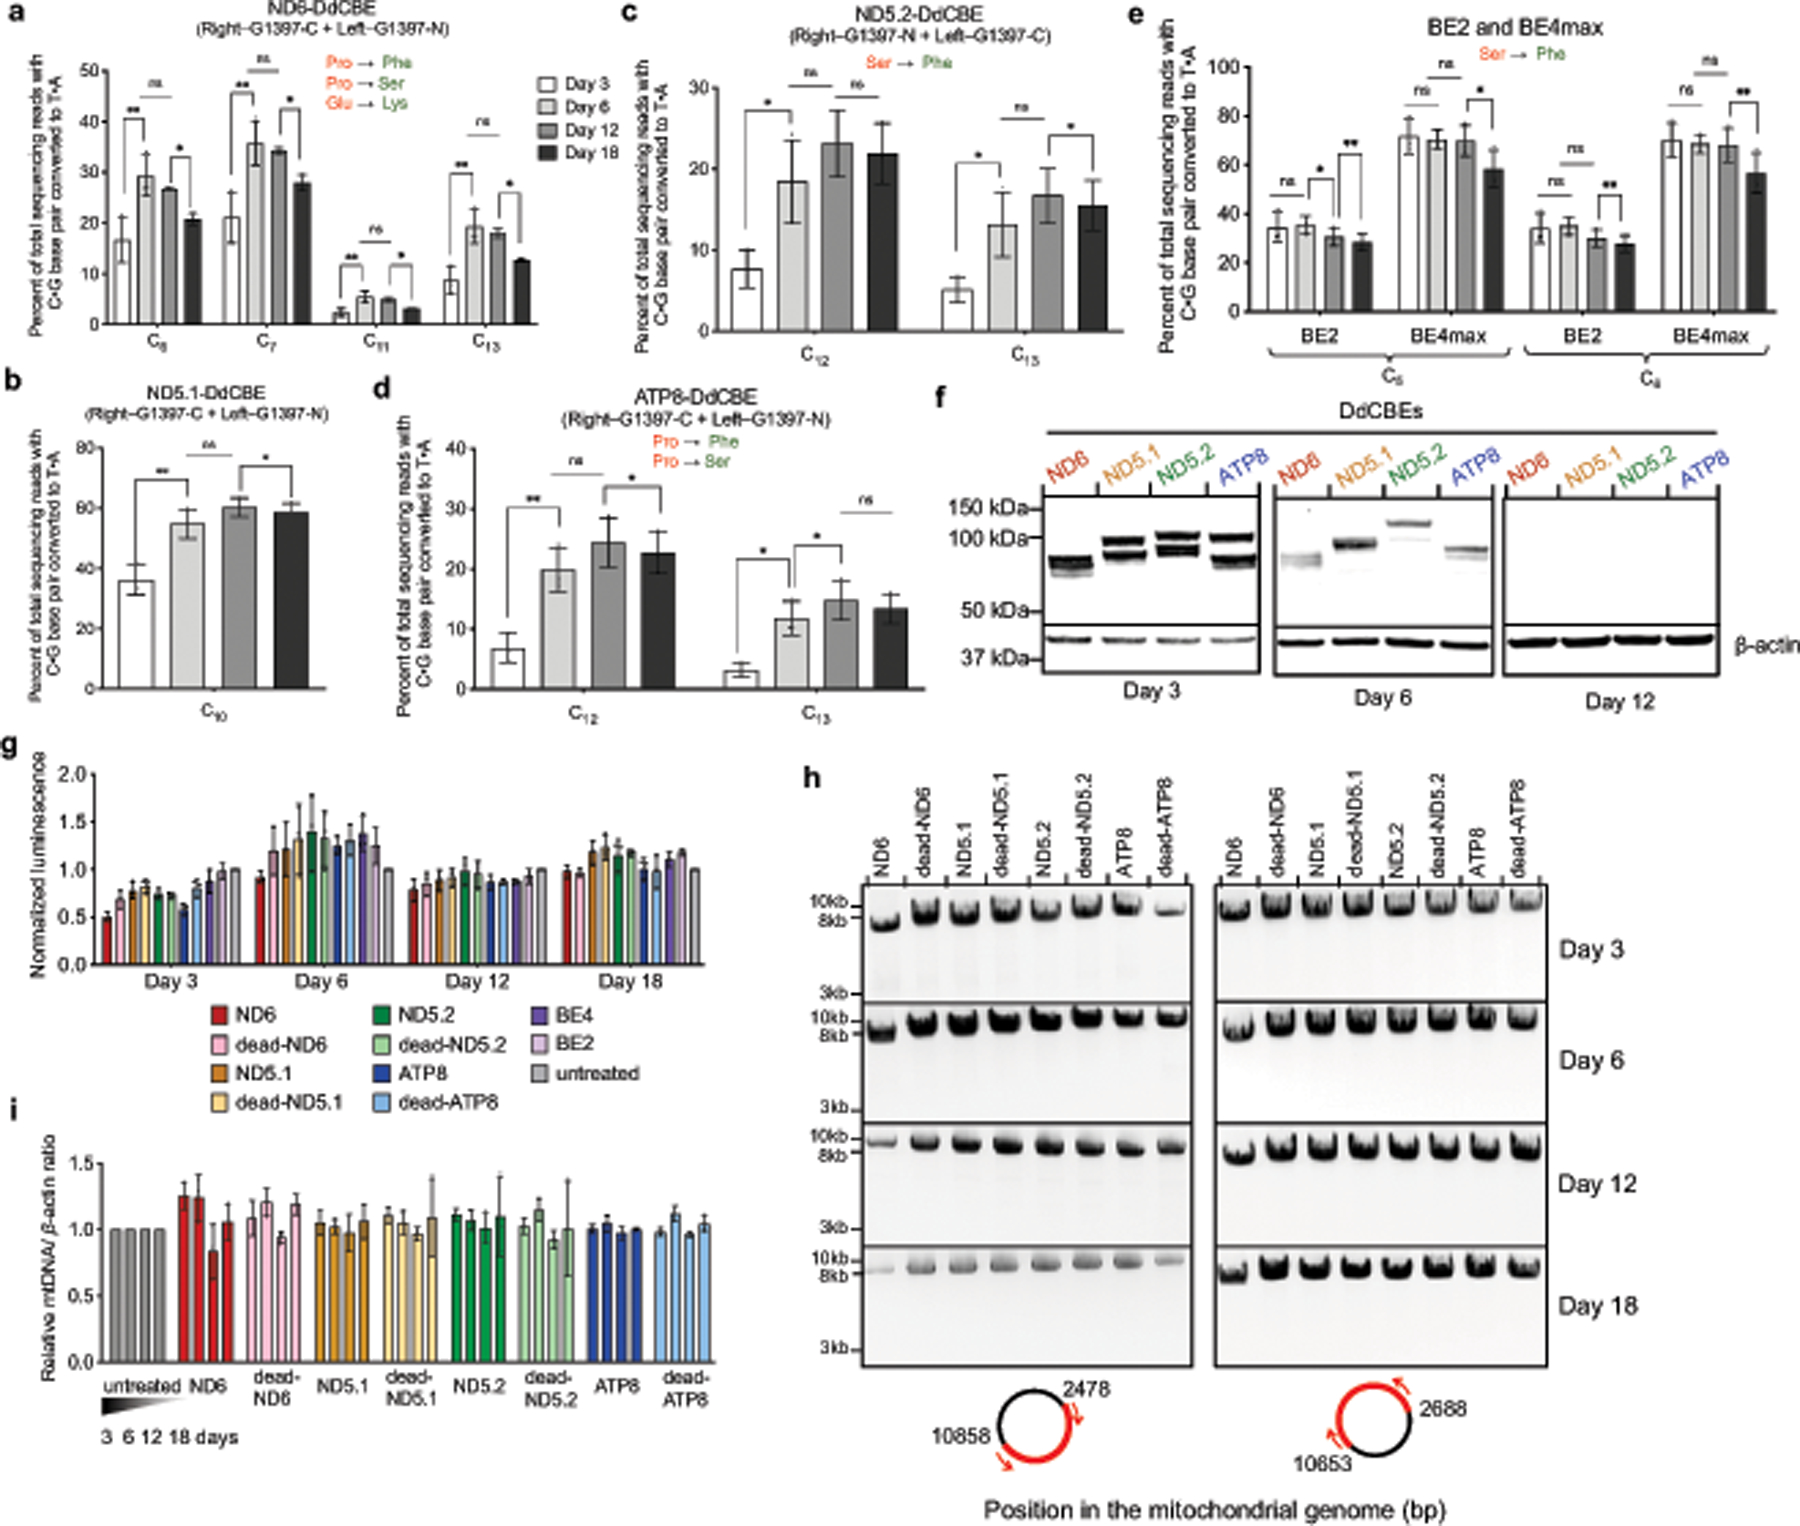
Extended Data Fig. 6 |. DdCBE editing in HEK293T cells persist over multiple divisions while maintaining cell viability and mitochondrial DNA integrity.

a–e, Editing efficiencies for optimized ND6-DdCBE (a), MTND5P1-DdCBE (denoted ND5.1-DdCBE) (b), MTND5P2-DdCBE (denoted ND5.2-DdCBE) (c), ATP8-DdCBE (d) and BE2max and BE4max (e) are shown for each time point. C•G-to-T•A conversions at protein-coding genes that generate missense mutations (green) of the putative amino acid (red) are shown. f, Western blots of ND6-, ND5.1-, ND5.2- and ATP8-DdCBE at various time points. The right halves were FLAG-tagged and the left halves were HA-tagged. Day 3 images are representative of n = 3 independent biological replicates; n = 1 for day 6 and day 12 images (see Supplementary Data 3 for uncropped images and fluorescent tagging of each half). Nuclear β-actin was used as a loading control. g, Cell viability was measured by recording the luminescence at the indicated time points. Luminescence values were normalized to the untreated control. h, DNA gel of PCR-amplified mtDNA captured as two amplicons (red). Images are representative of n = 3 independent biological replicates (see Supplementary Data 4 for uncropped images). i, mtDNA levels of DdCBE-edited cells were measured by qPCR relative to untreated cells. Values and error bars in a–e, g and i reflect the mean ± s.d. of n = 3 independent biological replicates. For a–e, asterisks indicate significant editing based on a comparison between indicated time points. *P < 0.05 and **P < 0.01 by Student’s two-tailed paired t-test. Individual P values are listed in Supplementary Table 7.
