
Fig. 3 |. TALE–split DddAtox fusions for mitochondrial base editing in HEK293T cells.
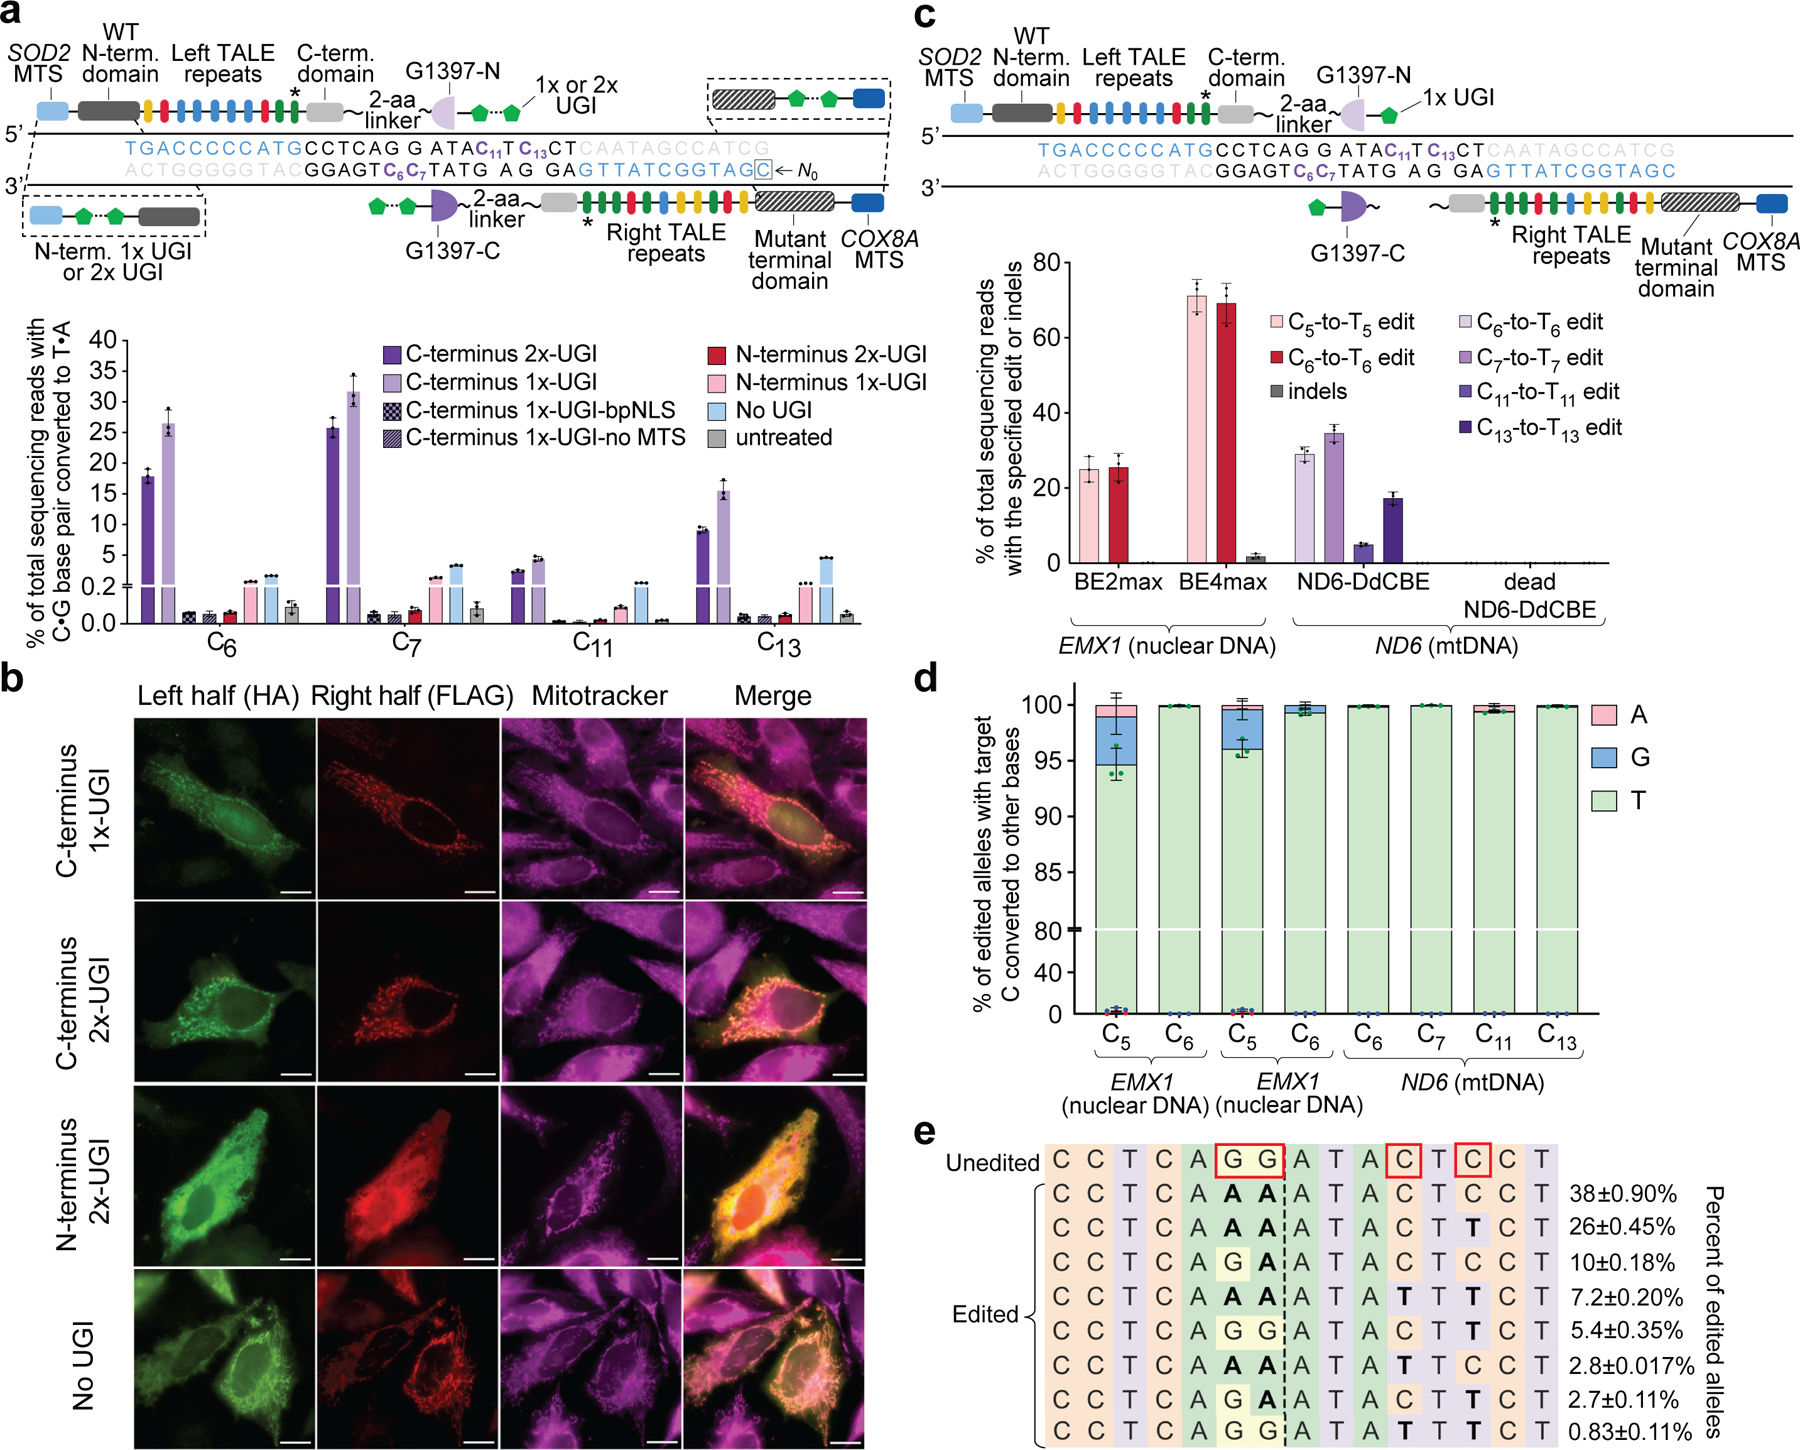
a, Top, candidate TALE–split DddAtox fusions to target MT-ND6. Target cytosines and TALE-binding sites are shown in purple and blue, respectively. Bottom, MT-ND6 editing efficiencies from fusions containing 1×- or 2×-UGI at the N- or C terminus 3 days post-transfection. b, Fluorescence imaging of HA- and FLAG-tagged halves of UGI–TALE–split DddAtox and TALE–split DddAtox–UGI pairs in HeLa cells 24 h after plasmid transfection. Mitochondrial localization was followed using MitoTracker (magenta). Scale bars, 10 μm. Images are representative of 3 independent biological replicates. c, Top, optimized DdCBE architecture containing one UGI fused to the C terminus of each TALE–split DddAtox fusion. Bottom, editing and indel frequencies at MT-ND6 (mtDNA) and EMX1 (nuclear DNA) 3 days post-transfection.BE2max, rAPOBEC1–dSpCas9–2×-UGI. For a and c, the last TALE repeat (*) does not match the reference genome9(see Supplementary Table 4). d, Outcomes among edited alleles in c are shown for the indicated DdCBE variants. e, Frequencies of MT-ND6 alleles in c. Edited cytosines are boxed. Values and error bars for a, c–e reflect the mean ± s.d. of n = 3 independent biological replicates.