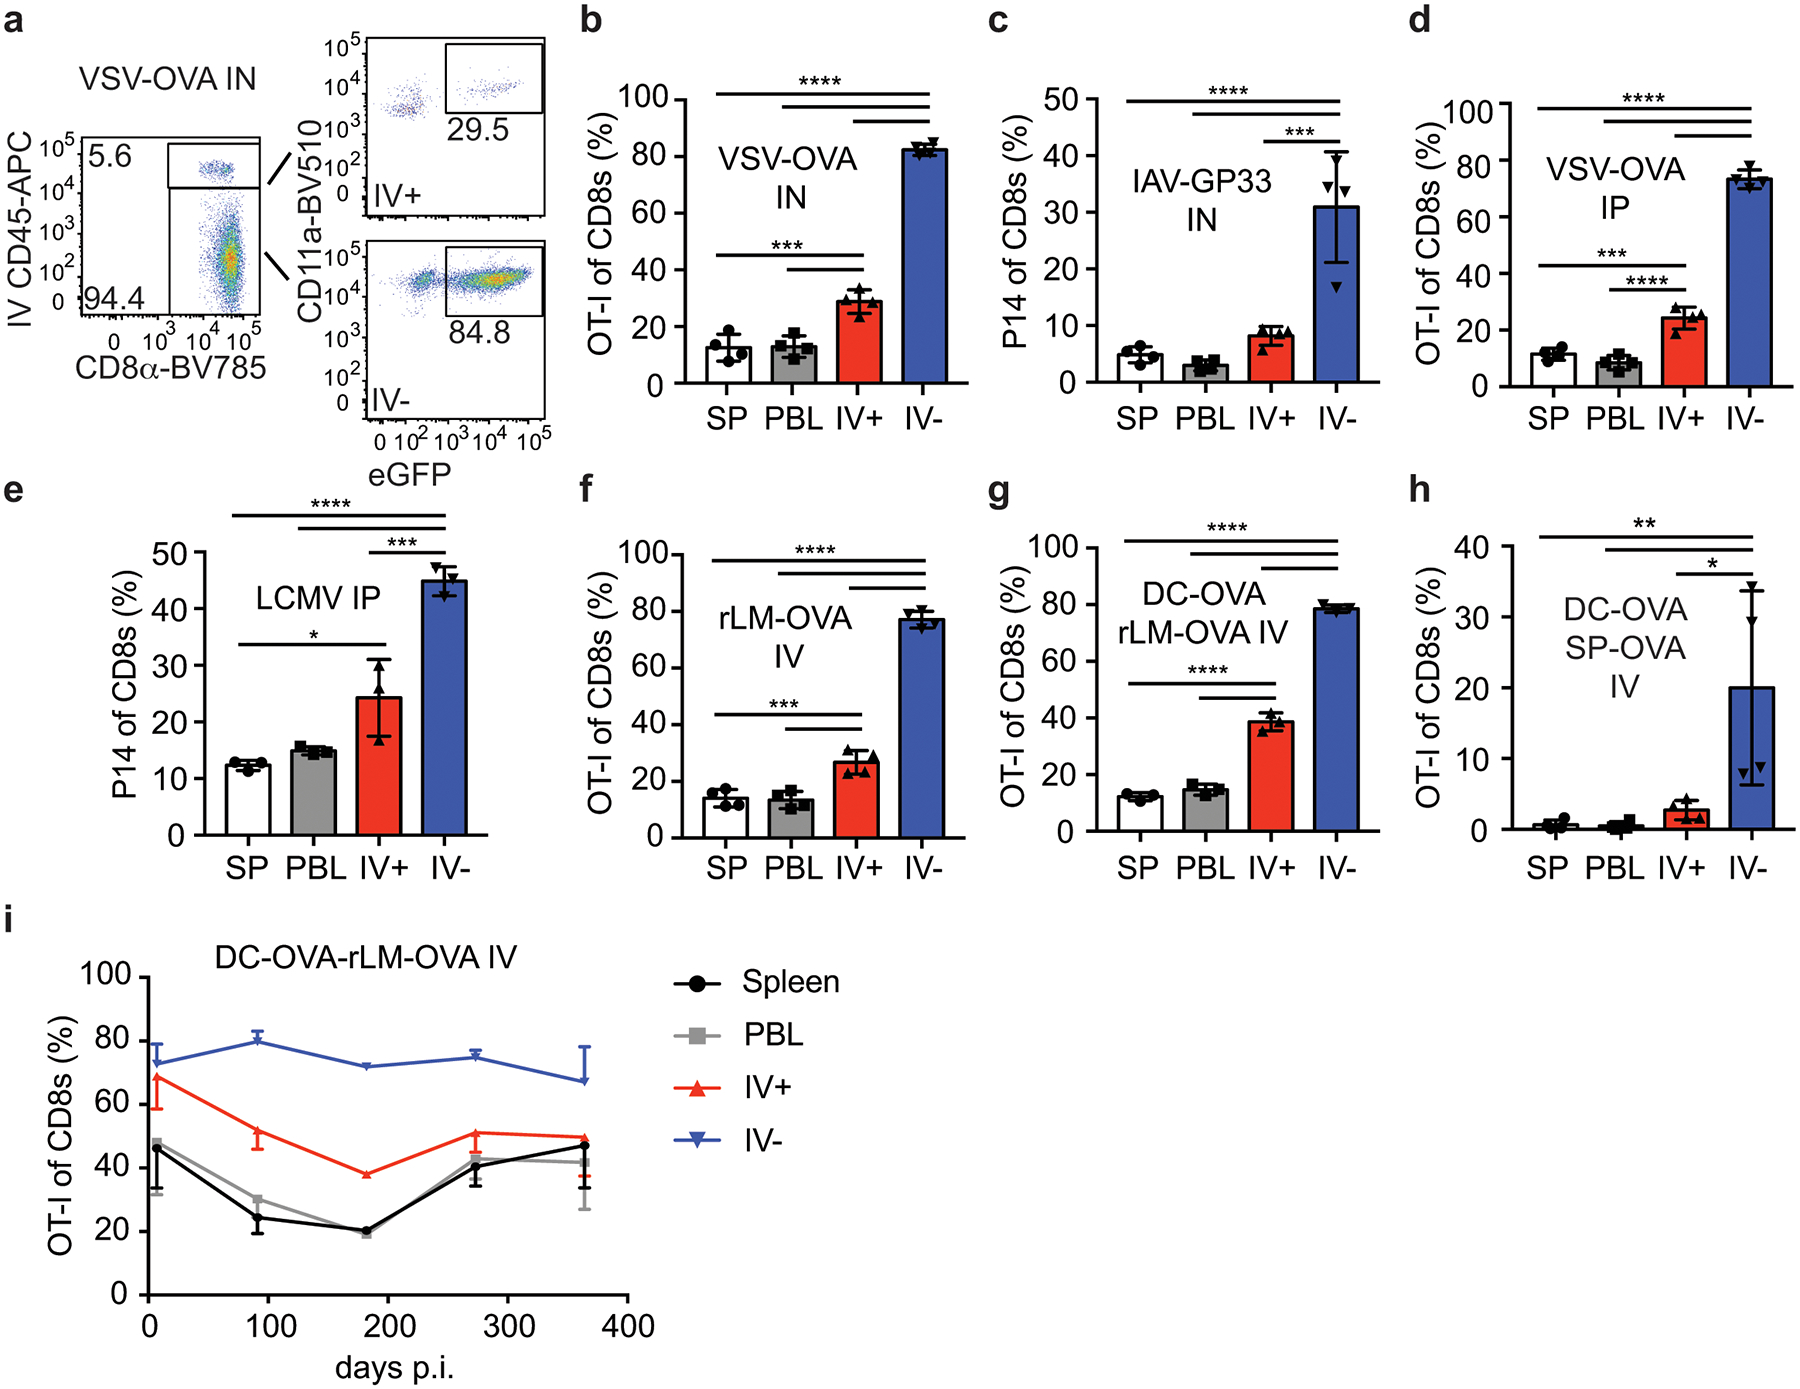
Figure 1: Enrichment of antigen specific CD8+ T cells in the CNS after peripheral immunizations.

a) Representative flow cytometry plots of brain samples isolated from mice seeded with eGFP+ OT-I CD8+ T cells and infected with VSV-OVA IN. Representative of 3 independent experiments with 4 mice per group.
b-i) The proportion of donor OT-I or P14 cells of live CD8+ T cells isolated from the Spleen (SP) peripheral blood (PBL) IV+ brain (IV+) or IV– brain (IV–) are graphed from memory >30 days or the indicated days after infection with VSV-OVA IN, n=4, 3 independent experiments, p values (top to bottom) **** p<0.0001, **** p<0.0001, **** p<0.0001, *** p=0.0003, *** p=0.0004 (b), IAV-GP33 IN, n=4, 2 independent experiments, p values (top to bottom) **** p<0.0001, **** p<0.0001, *** p=0.0002 (c), VSV-OVA IP, n=4, 3 independent experiments p values (top to bottom) **** p<0.0001, **** p<0.0001, **** p<0.0001, *** p=0.0003, **** p<0.0001 (d) LCMVArm IP, n=3, 3 independent experiments, p values (top to bottom) **** p<0.0001, **** p<0.0001, *** p=0.0006, * p=0.0169 (e), rLM-OVA IV, n=4, 2 independent experiments, p values (top to bottom) **** p<0.0001, **** p<0.0001, **** p<0.0001, *** p=0.0009, *** p=0.0006 (f), DC-OVA-rLM-OVA prime boost IV, n=3, 4 independent experiments, p values (top to bottom) **** p<0.0001, **** p<0.0001, **** p<0.0001, **** p<0.0001, **** p<0.0001 (g), DC-OVA-SP-OVA prime boost IV, n=4, 2 independent experiments, p values (top to bottom) ** p=0.0087, ** p=0.0083, * p=0.0183 (h), or DC-OVA-rLM-OVA IV, n= 3, 4, 2, 3, 3 at each respective time points (left to right) (i).Graphs show the mean +/− standard deviation (b-h) or mean +/− SEM (i) with each dot representing an individual mouse. Statistical significance was determined by One-way ANOVA with Tukey’s multiple comparison post-test using graphpad prism with individual P values reported between groups.
