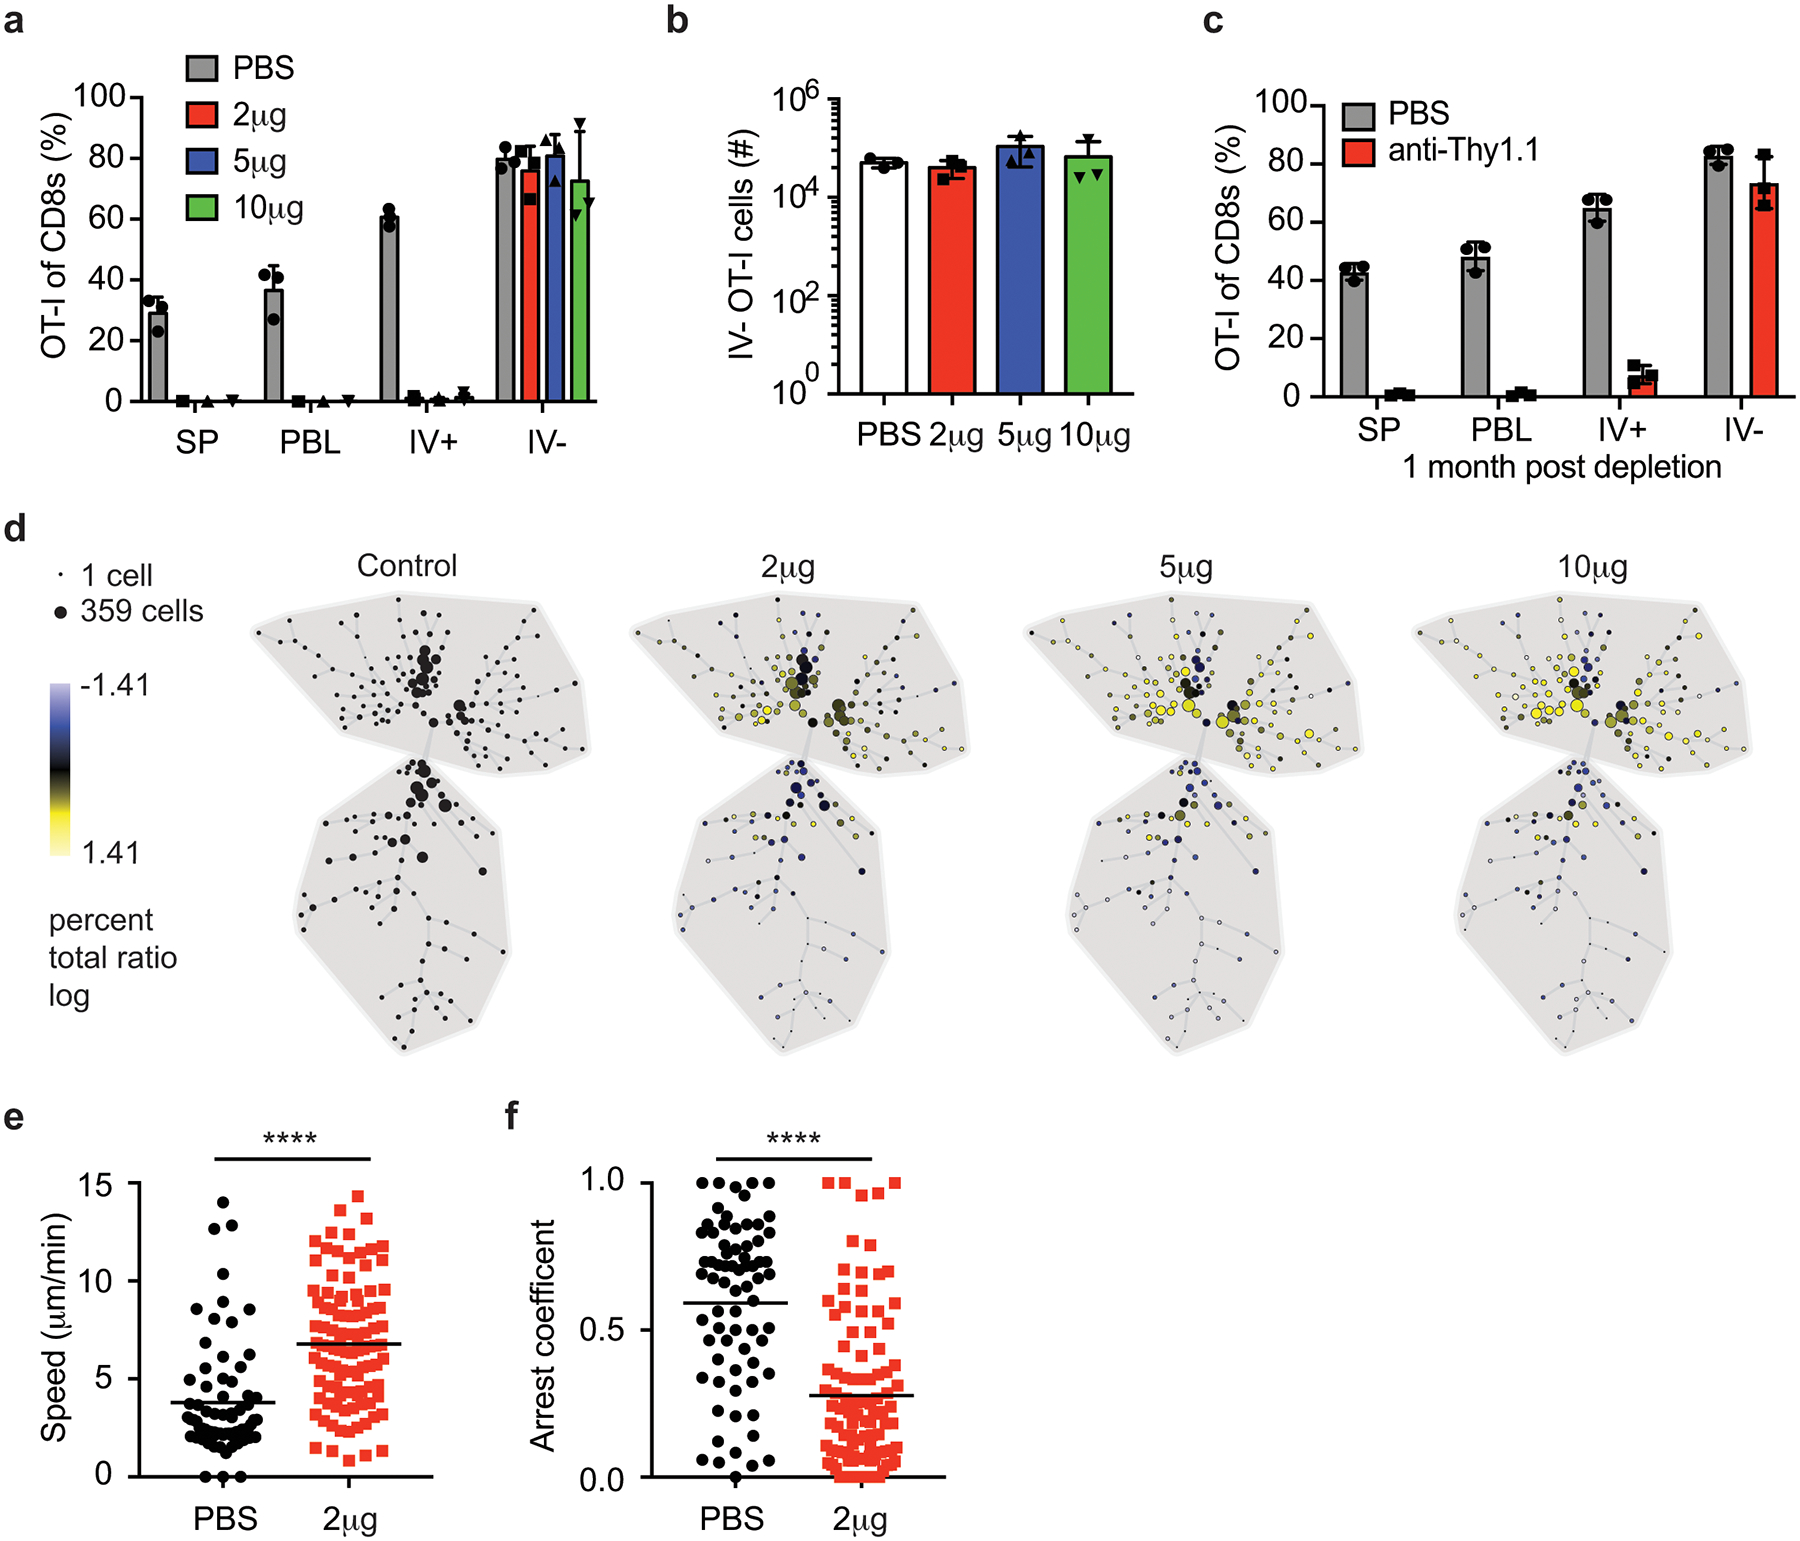
Figure 5: Peripherally induced CNS Trm cells are resistant to systemic depletion.

a-b) Thy1.1 eGFP+ OT-I T cells were transferred into naïve mice that were DC-OVA-rLM-OVA prime boosted. After memory formation, mice were control treated (PBS) or treated with 2, 5, or 10 μg of anti-Thy1.1 Ab IP and one week after depletion, phenotype and numbers of donor cells were determined. Proportion of OT-I cells in spleen (SP), PBL, IV+ brain and IV– brain of CD8+ T cells are graphed (a). Number of IV– OT-I cells in brain are graphed (b). Data are representative of 2 independent experiments with 3 mice per group. Graphs show the mean +/− standard deviation with each dot representing an individual mouse.
c) Thy1.1 eGFP+ OT-I T cells were transferred into naïve mice that were DC-OVA-rLM-OVA prime boosted. After memory formation, mice were control treated (PBS) or treated with 2 μg of anti-Thy1.1 Ab IP. One month after depletion, phenotype and numbers of donor cells were determined. Proportion of OT-I cells of CD8+ T cells are graphed (c). Data are representative of 2 independent experiments with 3 mice per group. Graphs show the mean +/− standard deviation with each dot representing an individual mouse.
d) Thy1.1 eGFP+ OT-I T cells were transferred into naïve mice that were DC-OVA-rLM-OVA prime boosted. After memory formation, mice were control treated (PBS) or treated with 2, 5, or 10 μg of anti-Thy1.1 Ab IP one week after depletion, SPADE analysis of IV– OT-I cells from each group are depicted.
e,f) Thy1.1 eGFP+ OT-I T cells were transferred into naïve mice that were DC-OVA-rLM-OVA prime boosted. After memory formation, mice were control treated (PBS) or treated with 2 μg of anti-Thy1.1 Ab IP One week after depletion, OT-I cells in the CNS were imaged and average cell speed (e) and arrest coefficients (f) were determined. Graphs show the mean +/− standard deviation with each dot representing an individual cell, analyzing 71 cells from 12 individual movies (PBS), and 103 cells from 16 individual movies (2 μg). Statistical significance was determined by two-sided Mann Whitney test using graphpad prism where **** p<0.0001 (e) and **** p<0.0001 (f).
