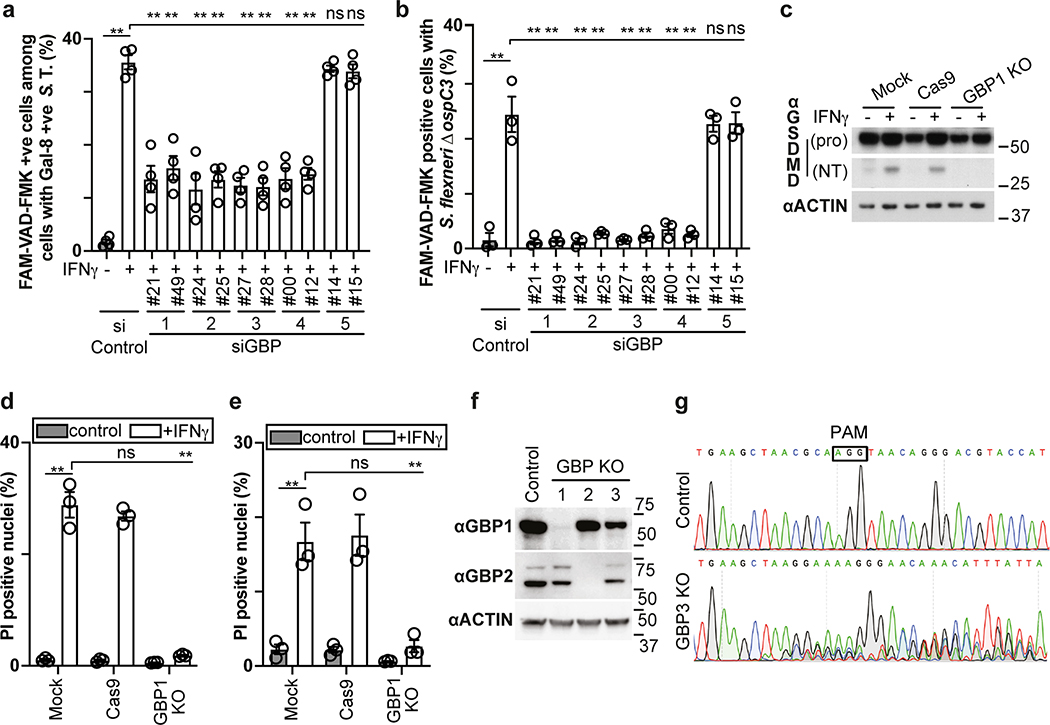
Extended Data Fig. 8. GBPs govern gasdermin-D dependent pyroptosis.
a,b, Percentage of FAM-VAD-FMK positive cells among HeLa cells containing S. Typhimurium positive for endogenous Galectin-8 at 90 min p.i. (a) or containing S. flexneri ΔospC3 at 1 h p.i. (b); cells treated with siRNAs against GBPs as indicated. n > 100 cells with Galectin-8 +ve bacteria (a) or n > 100 infected cells (b) per coverslip, in triplicate.
c, Lysates of the indicated control or knock-out HeLa cells infected with S. flexneri ΔospC3 for 1h. Pro - full length pro-form of GSDMD (shorter exposure), NT - N-terminal domain of GSDMD (longer exposure). Samples in Extended Data Fig. 8c, Extended Data Fig. 5b and Extended Data Fig. 9f were obtained from the same experiment.
d,e, Percentage of PI positive nuclei in the indicated control or knock-out HeLa cells at 2 h p.i. with S. Typhimurium (e) or S. flexneri ΔospC3 (d).
f, Lysates of the indicated control or knock-out U937 cells.
g, Sanger sequencing chromatogram of control and GBP3 knock-out U937 cells.
Statistical significance was assessed by one-way analysis of variance (ANOVA) with Tukey’s multiple comparisons test (a,b,d,e); ns, not significant, **P < 0.01 (exact p values are provided in Supplementary Table 1). Data are expressed as the Mean ± SEM of three (b,d,e) or four (a) independent experiments, or representative of two (c,f) independent experiments.
HeLa cells were treated with IFN-γ as indicated (a-f). Blots were probed with indicated antibodies, Actin – loading control (c,f). Uncropped blots (c,f) are shown in the Source Data. PI - propidium iodide, p.i. - post-infection, +ve – positive. S. T - S. Typhimurium.

