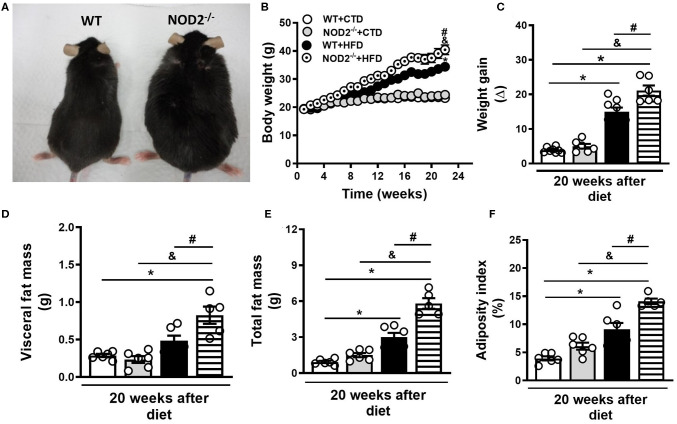
Figure 1.
Nutritional parameters of WT and NOD2−/− mice fed a CTD or a HFD. Representative images of NOD2−/− mice (right) and WT mice (left) fed a HFD (A). Body weight (B), weight gain (C), VAT mass (D), total fat mass (E), and adiposity index (F) were determined in NOD2−/− and WT mice after 20 weeks on HFD or CTD. The results are expressed as the mean ± SEM and are a compilation of 3 independent experiments (n = 5–8 mice per group). Asterisks represent statistically significant differences (*p < 0.05) compared to WT on CTD; (#p < 0.05) compared to WT on HFD; (&p < 0.05) compared to NOD2−/− mice on CTD. Significant differences between the groups were compared by one-way ANOVA followed by Tukey's multiple-comparison test.

