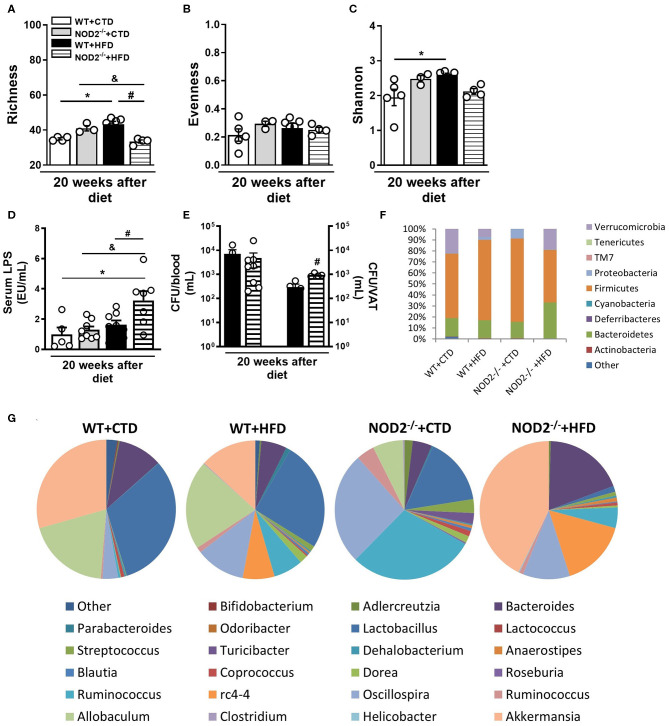
Figure 6.
Gut microbiota composition, intestinal permeability and bacterial translocation in WT and NOD2−/− mice fed a CTD or HFD. Richness (A), evenness (B), and Shannon index (C) of fecal bacterial OTUs. Serum LPS levels (D) and colony-forming unit numbers (CFU) in the blood or VAT (E) was assessed. Relative abundance of fecal bacterial phylum (F) and genera (G) was determined by 16S rRNA gene sequencing. The results are expressed as the mean ± SEM and are a compilation of 3 independent experiments (n = 4–8 mice per group) (D,E) or represent a single experiment (n = 3–5 mice per group) (A–C,F,G). Asterisks represent statistically significant differences (*p < 0.05) compared to WT on CTD; (#p < 0.05) compared to WT on HFD; (&p < 0.05) compared to NOD2−/− mice on CTD. Significant differences between two groups were compared by Student's t-test followed Mann-Whitney test; and between more groups by one-way ANOVA followed by Tukey's multiple-comparison test.

