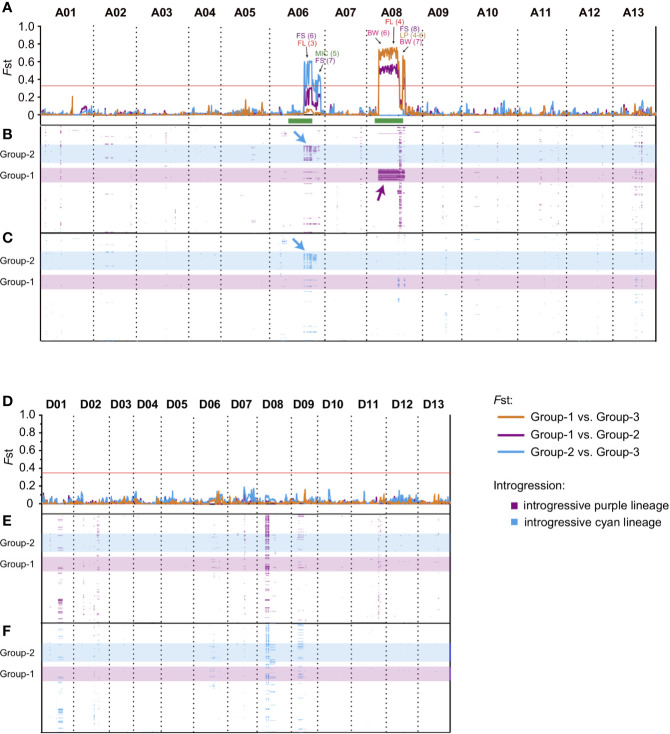
Figure 3.
The differentiation and introgression within cultivar population. The divergent genomic regions on At subgenome (A) and Dt subgenome (D) within Upland cotton cultivars. The y axis indicates the Fst value, and three comparisons of Group-1 vs. Group-3 (orange), Group-2 vs. Group-3 (light blue) and Group-1 vs. Group-2 (purple) are represented by lines with different colors, respectively, the horizontal red lines represent the threshold value of Fst (top 1%, Fst >0.364), and the regions above lines indicates the divergent genomic regions within Upland cotton cultivars. QTLs corresponding to different traits were marked by different colors; the number in parentheses indicates the QTL IDs (detailed information of QTLs are listed in Supplementary Table S3). BW, boll weight; SI, seed index; LP, lint percentage; FL, fiber length; FS, fiber strength; MIC, micronaire. The green bars at the bottom of Chr. A06 and A08 indicate their putative pericentromeric regions (Wang S. et al., 2015). The introgression regions (introgression index >0.15) derived from “purple” (B, E) and “light blue” (C, F) lineages were presented by purple and light blue band, y-axis of (B), (C), (E), and (F) indicated the cultivars, the order of accessions were consistent with cluster result (Figures 1A, B). The position of Group-1 (light blue) and Group-2 (purple) were highlighted by a transparent band. The major introgression fragments on A06 (blue) and A08 (purple) were marked by arrows. All QTL references were listed in Supplementary Table S3.

