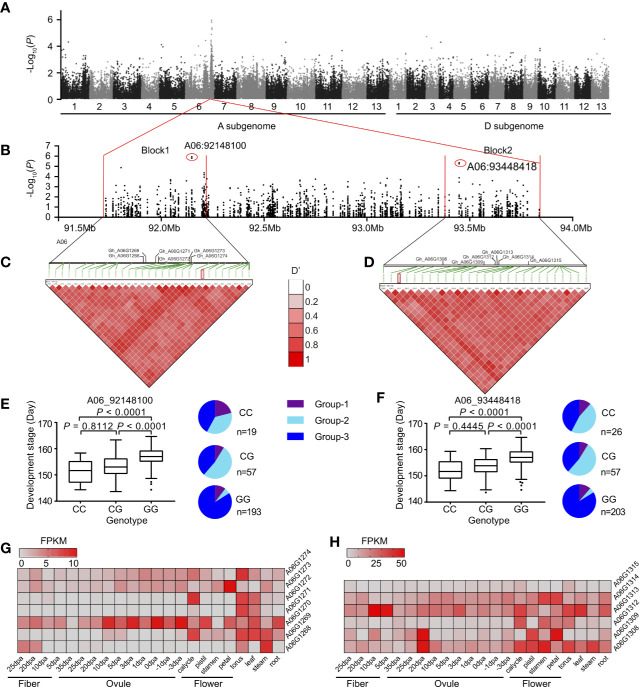
Figure 4.
The maturity trait-associated loci in the divergence region on chromosome A06. (A) Manhattan plots of GWAS for the development stage (Nanjing-2009). (B) the local Manhattan plot for the signals on chromosome A06, two strongest signals (A06_92148100 and A06_93448418) were marked by red circles. (C, D) The LD heatmap and annotated genes in two blocks. The location of the strongest signals was labeled by red rectangles. (E, F) Box plots for the development stage, according to the genotype of two strongest signals A06_92148100 (left) and A06_93448418 (right). In the box plots, the centerline, box limits, and whiskers indicates median, upper and lower quartiles, and 1.5× interquartile range, respectively. Points show outliers. Significances were tested by Dunn's multiple comparison test. The pie charts indicated the sub-group categorization of the strongest signals in GWAS population. The heatmaps indicated the level of genes in block 1 (G) and block 2 (H), respectively. FPKM, fragments per kilobase per million.

