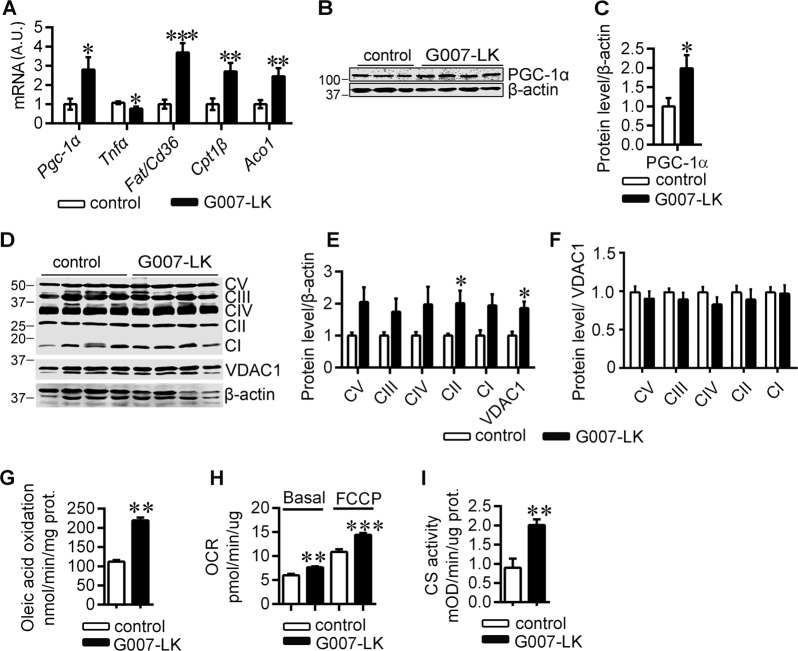
Fig. 3. TNKS inhibition increases mitochondrial mass in muscle in db/db mice and mitochondrial mass and oxidative metabolism in cultured myotubes.
a qRT-PCR analyses of genes associated with fatty acid oxidation in muscle of G007-LK-treated and control db/db mice (A.U., arbitrary unit). Representative immunoblot (b) and quantification (c) of PGC-1α in muscle of G007-LK-treated and control db/db mice. Immunoblot analysis (d) and corresponding quantification (e, f) of the subunits of mitochondrial OXPHOS complexes and VDAC1 normalized to β-actin (e) and the OXPHOS complexes normalized to VDAC1 (f) in G007-LK treated and control db/db muscle. CI: NDUFB8, (NADH dehydrogenase 1β subcomplex subunit 8), CII: SDHB, (succinate dehydrogenase b iron–sulfur subunit), CIII: UQCRC2 (cytochrome b-c1 complex subunit 2), CIV: MTCO1 (cytochrome c oxidase subunit 1) and CV: ATP5A (ATP synthase subunit α). Oleic acid oxidation (g), O2 consumption rates (OCR) (h), and citrate synthase activity (i) in C2C12 myotubes after 24 h pretreatment with either vehicle or 10 nM G007-LK, the lowest effective concentration. Error bars represent ±SEM. Two-tailed t-test and in (g–i), two-way ANOVA for multiple comparisons. *p < 0.05; **p < 0.01; ***p < 0.001. In muscle (a–f) control n = 3–5; G007-LK n = 4–5. In oleic acid oxidation (g) control n = 4; G007-LK n = 6, in Seahorse respirometry (h) control n = 10; G007-LK n = 20, and in citrate synthase assay (i) control n = 10; G007-LK n = 20. Assays were repeated several times in C2C12 myotubes and representative results are shown from one batch of cells after G007-LK treatment.

