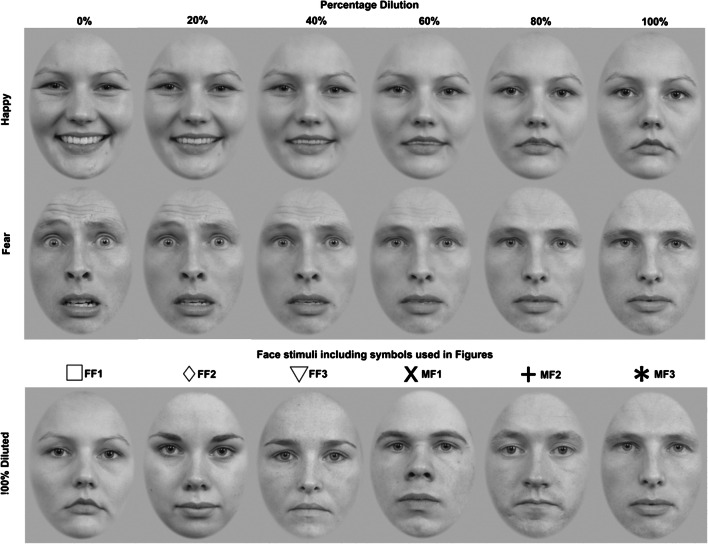
Fig. 1.
Examples of happy (top row) and fearful images (middle) used as stimuli for a range of stimulus dilutions (0%–100%). Stimulus dilution increases from left to right showing how the full intensity expression (0%) changes with increasing dilution until the image becomes neutral (100%). The bottom row provides examples of the neutral images (100%) of each face with corresponding symbols used to plot data in Figs. 5b and 6. There are three female faces (open symbols; FF1, FF2, and FF3) and three male faces (symbols; MF1, MF2, and MF3)

