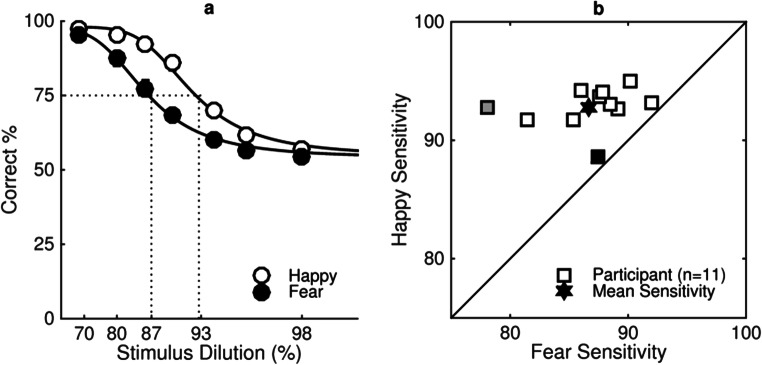
Fig. 3.
a Group sensitivity measure to happy (open symbols) and fearful (filled symbols) expressions. The percentage of trials participants (n = 11) correctly identified the expressive face as being more expressive than the neutral face is plotted as a function of stimulus dilution (%). b Individual sensitivity measures to happy (y-axis) and fearful (x-axis) expressions. Each square represents an individual participant’s data, and mean sensitivity is represented by the filled star. The grey square indicates the individual whose results are explored in more detail in Fig. 5. The black square indicates an individual for whom there is no statistical difference between sensitivity to happy and fear. Stimuli were presented for 200 ms, and participants sat 50 cm from the screen such that images subtended 19° × 27° of visual angle

