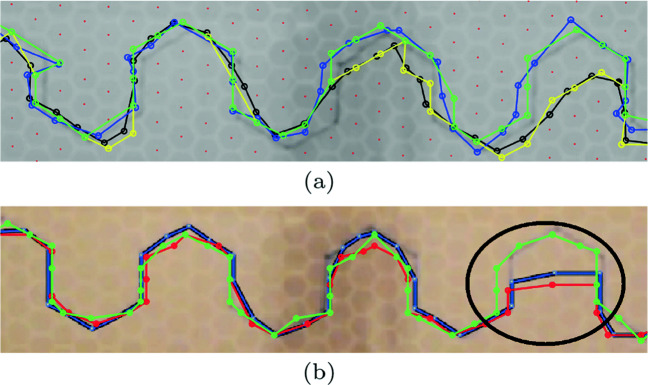
Fig. 6.
Pursuit trajectories analysis. a The black and blue trajectories are of prey and predator, respectively. Green and yellow trajectories are the associated trajectories with the hexagonal grid center points. The center points of hexagonal grid cells are red dots. b The red and green trajectories are of prey and predator, respectively. The visible trajectory erroneous area is encircled black. The associated true trajectory can be seen in (a)

