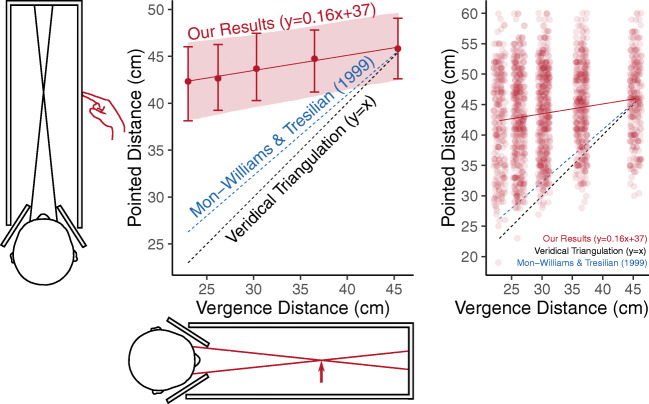
Fig. 5.
Summary of results from Experiment 2 when vergence and accommodation are the only cues to distance. On the x-axis is the vergence-specified distance, and on the y-axis the pointed distance. The left panel illustrates averaged results. The error bars represent bootstrapped 95% confidence intervals across observers. The error band represents the bootstrapped 95% confidence interval of the linear mixed-effects model. The right panel plots the raw trial data across observers as a jitter plot

