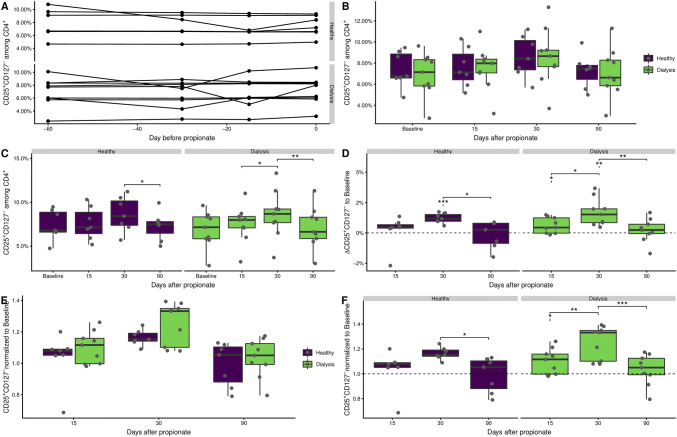
Fig. 1.
CD25highCD127− Tregs expand during propionate supplementation. Cells were analyzed ex vivo by flow cytometry. Tregs were identified as CD25highCD127− according to the gating strategy in Supplementary Fig. 2. a Frequency of Tregs during the baseline phase of the study. The average over the baseline phase was taken for each study participant and used as a single baseline value. b Frequency of Tregs during the propionate supplementation and follow-up phase of the study focusing on differences between study groups. c As in b but focusing on changes over time. d Difference of Treg frequencies over time to the base line. The downward pointing line under asterisks indicates comparison of mean to 0. e Ratio of Tregs frequency during the propionate and follow-up phase to the baseline focusing on differences between study groups. f As in e but with focus on changes over time. The downward pointing line under asterisks indicates comparison of mean to 1. The boxes represent the 25th, 50th, and 75th percentile and the whiskers represent the range of the observations excluding outliers. Each point signifies a single donor. Only significant differences are annotated. Asterisks indicate the p value (*p < 0.05; **p < 0.01; ***p < 0.001)

