
FIGURE 3.
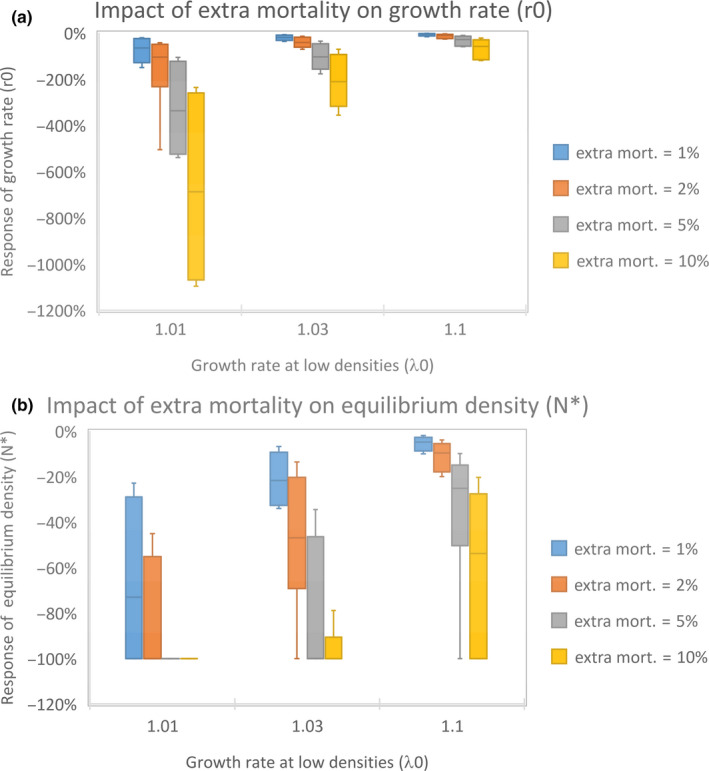
Box plots depicting the impact (percentage decline) of extra mortality on the growth rate (a) and equilibrium density (b) in bird species at various intrinsic growth rates (λ 0). Quartile variation indicates the response variation between species. Species with low intrinsic growth rate (λ 0) at low densities are very sensitive to extra mortality