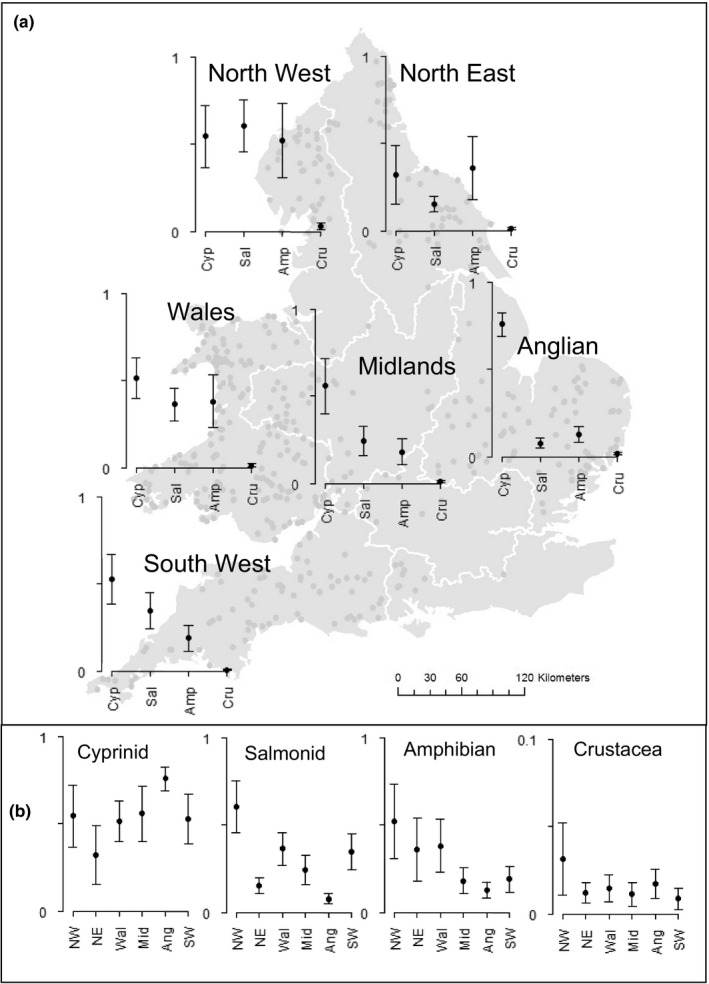
FIGURE 5.

Spatial variation in otter diet. Black circles indicate average model‐predicted probability of prey taxon occurring in otter diet (± standard error), for all models where significant associations with region were indicated. Note that other prey types, for example, eel and bullhead, were equally important across all regions (see frequency of occurrence, Table 1). Predictions by region are made while other significant predictor variables are standardized (see Section 2). Too few data were available to reliably predict probabilities for Thames or Southern regions; pairwise differences were not tested for significance due to high likelihood of error due to multiple testing. (a) Gray dots indicate locations where otter samples were sourced (note that the distribution of points is not homogenous within regions, particularly NW and Midlands); white lines indicate regional boundaries, which follow river catchments. Taxa are labelled as underlined: Cyprinid, Salmonid, Amphibian, and Crustacean. (b) Standard compass point abbreviations are used for NW, NE, and SW Regions, or as underlined for Wales, Midlands, and Anglian). Note adjusted scale on y‐axis for Crustacea. Details for mammal predation not shown due to a low probability of occurrence and large standard errors
