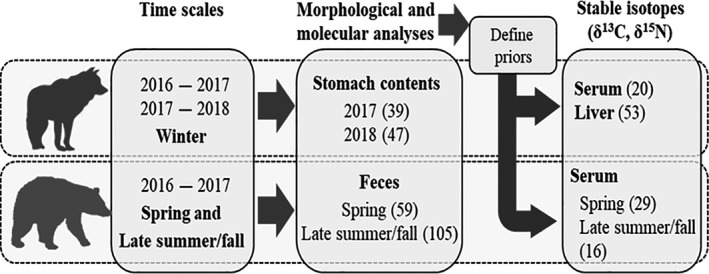
FIGURE 2.

Summary diagram showing sample sizes available for the combined use of morphological, molecular, and stable isotope analyses to determine the diet of wolves and black bears in northern Québec and Labrador, Canada. Numbers in parentheses refer to sample sizes for each species–tissue combination
