
FIGURE 3.
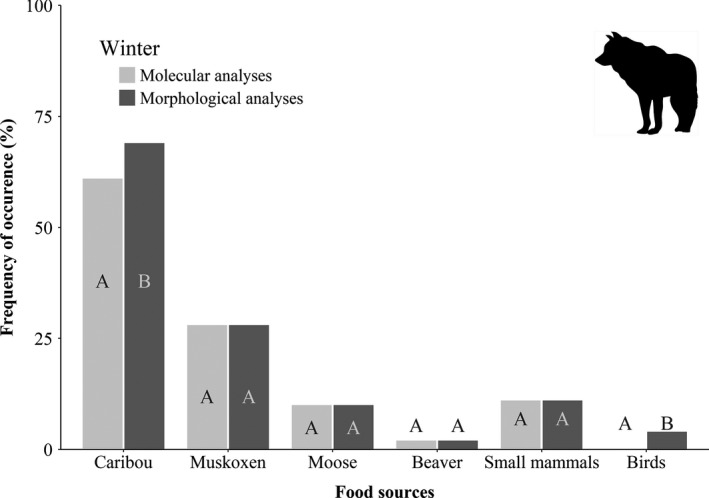
Frequency of occurrence (%FO) of food sources in the diet of wolves during winter in northern Québec (Canada) based on morphological (undigested remains) and molecular analyses (DNA barcoding) of stomach contents. Within a given food source, different letters indicate significant differences (p ≤.05) between approaches