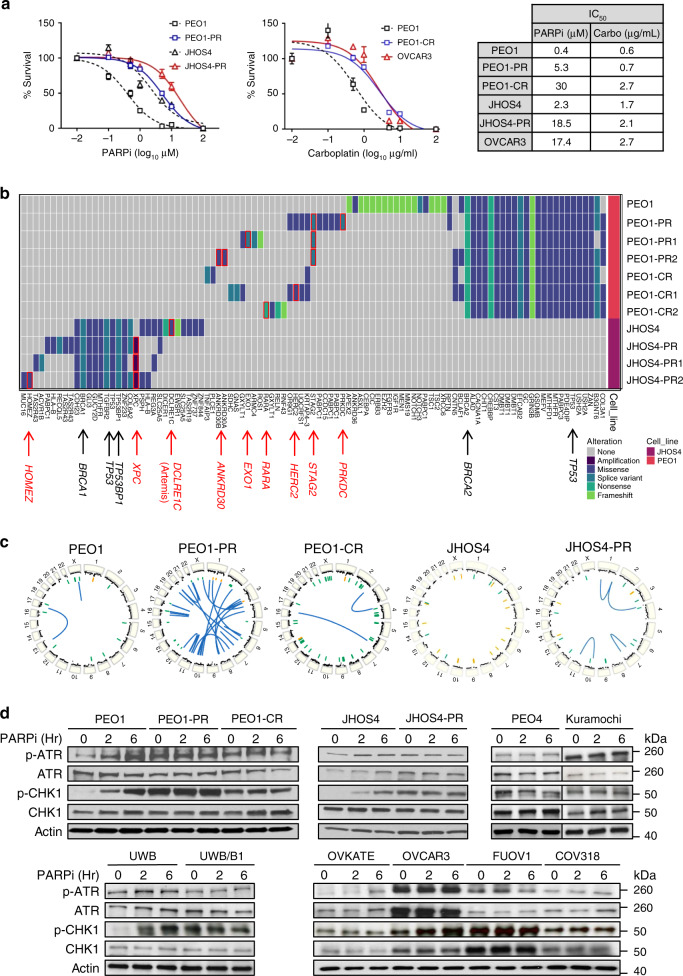
Fig. 1. Drug-resistant cells acquire genetic alterations and increase ATR/CHK1 signaling.
a Drug-response curves of survival after PARPi (olaparib, left) and carboplatin (right) treatment in HR-deficient parental cells (PEO1, BRCA2MUT; JHOS4, BRCA1MUT), acquired PARPi-resistant cells (PEO1-PR; JHOS4-PR), and carboplatin-resistant cells (PEO1-CR, and OVCAR3 with CCNE1AMP) at 5 days. Nonlinear regression curve was generated using MTT data (dose–response inhibition). IC50 was calculated by Graph Pad Prism. The fitted midpoints (lC50) of the two curves statistically compared by Extra sum-of squares F test (one-way). Mean ± SD shown (n = 3 independent biological replicates per treatment; experiment repeated at least thrice). PEO1 vs PEO1-PR, P < 0.0001; JHOS4 vs JHOS4-PR, P < 0.0001; PEO1 vs PEO1-CR, P < 0.0001; PEO1 vs OVCAR3, P < 0.0001. b Heatmap of genes and structural alterations present in samples from parental BRCAMUT (JHOS4 and PEO1), acquired PARPi-resistant (PEO1-PR, PR1, PR2; JHOS4-PR, PR1, and PR2), and acquired carboplatin-resistant cell line (PEO1-CR, CR1, and CR2). Each column represents a separate alteration by either sequence or structural change, while each row represents a cell line. c Circos plots depict copy-number alterations as well as intra- and inter-chromosomal rearrangements. Focal amplifications in yellow, and focal deletions in green. Inter- and intra-chromosomal rearrangements in blue. d Parental (BRCAMUT PEO1, JHOS4, and UWB; CCNE1 copy normal, OVKATE), acquired PARPi-resistant (PEO1-PR and JHOS4-PR), de novo PARPi-resistant (PEO4, Kuramochi, and UWB/BRCA1+/−), and platinum-resistant cells (PEO1-CR; CCNE1Amp OVCAR3, FUOV1, and COV318) were treated with PARPi 1 μM and lysates were collected at 0, 2, 6 h. Cells were selected in PARPi or carboplatin and tested after a 10-day drug washout (except CCNE1AMP cells). Western blot for the indicated phospho and total proteins was performed. Representative data shown are one of three independent biological repeat experiments. Source data are provided as a source data file.

