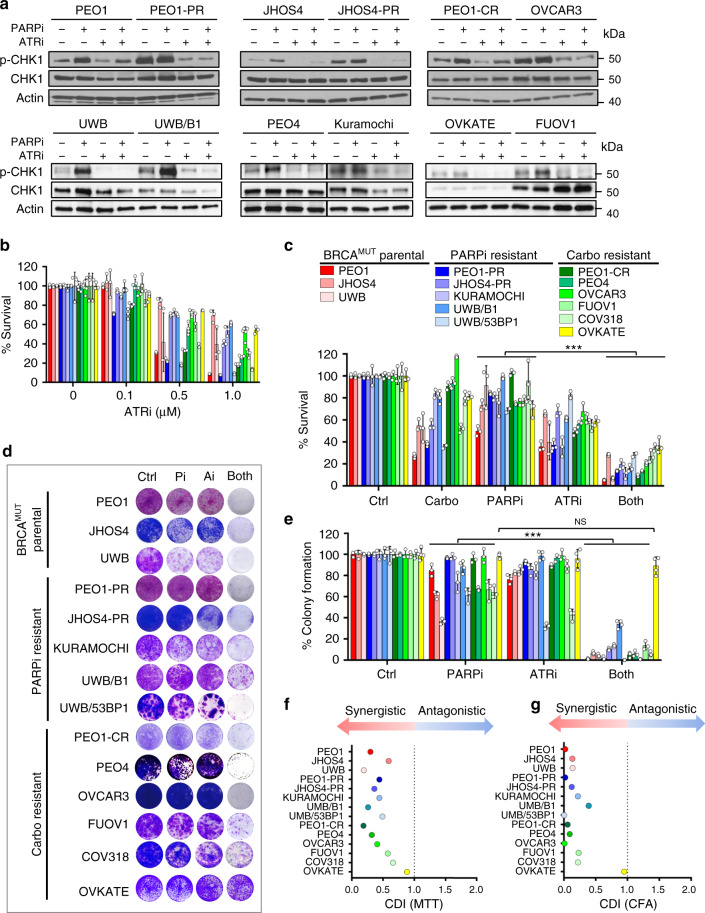
Fig. 2. PARPi–ATRi treatment decreases cell viability and colony formation.
a Western analysis of ATR target, pCHK1/CHK1 in parental BRCAMUT (BRCA2MUT: PEO1; BRCA1MUT: JHOS4 and UWB), acquired PARPi-resistant (PEO1-PR, JHOS4-PR), de novo PARPi resistant (PEO4, Kuramochi, UWB/B1, B1 denotes BRCA1+/−), and platinum-resistant (PEO1-CR, PEO4; CCNE1Amp: OVCAR3, FUOV1 with OVKATE CCNE1 copy normal) cells after treatment with PARPi (1 μM), ATRi (1 μM), or Both. Representative of three independent biological assays is shown. Band density is normalized to corresponding Actin band (ImageJ). b Viability after ATRi treatment in parental BRCA mutant, PARPi-resistant cells, and carboplatin-resistant cells by MTT at 5 days. c Viability after treatment with carboplatin (1 μg/ml all lines), PARPi (0.1 μM: UWB, UWB/B1, COV318; 0.5 μM: PEO1, PEO4, OVCAR3, FUOV1, JHOS4-PR; 1 μM: PEO1-PR, PEO1-CR, JHOS4, UWB/53BP1, Kuramochi, and OVKATE), ATRi (0.1 μM, UWB/53BP1; 0.5 μM: PEO1, PEO1-CR, JHOS4, COV318, PEO4, PEO1-PR JHOS4-PR, Kuramochi, FUOV1; 1 μM: OVCAR3, UWB, UWB/B1, OVKATE) assessed by MTT at 5 days. Viability in PARPi–ATRi group was lower than PARPi monotherapy for all lines (COV318, OVKATE, P = 0.0006, other lines ***P < 0.0001), and ATRi monotherapy for all lines (UWB, Kuramochi, COV318, P = 0.04; OVKATE, P = 0.008; FUOV1, P = 0.0003; remaining lines, P < 0.0001). d, e Colony formation (CF) after treatment with lowest doses demonstrating synergy for PARPi (0.1 μM: PEO1, JHOS4, JHOS4-PR, OVCAR3, UWB, UWB/53BP1; 0.5 μM: PEO1-PR, PEO1-CR, PEO4, FUOV1, Kuramochi, OVKATE; 1 μM, COV318; 2 μM, UWB/B1), ATRi (0.1 μM: JHOS4, UWB, UWB/B1, UWB/53BP1, FUOV1; 0.25 μM, Kuramochi, COV318, OVKATE; 0.3 μM: PEO1-CR; 0.5 μM: PEO4, PEO1, PEO1-PR, JHOS4-PR, OVCAR3) and combination for 13 days; colonies quantified using ImageJ. CF for PARPi–ATRi was lower than PARPi (***P < 0.0001) or ATRi monotherapy for all lines (PARPi–ATRi vs ATRi, UWB 53BP1, P = 0.0003; remaining lines, P < 0.0001), except OVKATE (PARPi–ATRi vs PARPi P = 0.3035, PARPi–ATRi vs ATRi P = 0.5073). Data analyzed using one-way ANOVA followed by Tukey’s multiple-comparisons test with data shown as mean ± SD; n = 3 biologically independent samples. f, g Mean % survival and colony formation of a single representative experiment with three determinations was used to calculate coefficient of drug interaction (CDI). CDI < 1 indicated synergism, CDI < 0.7 significant synergism, CDI = 1 additivity, CDI > 1 antagonism. Source data are provided as a source data file.

