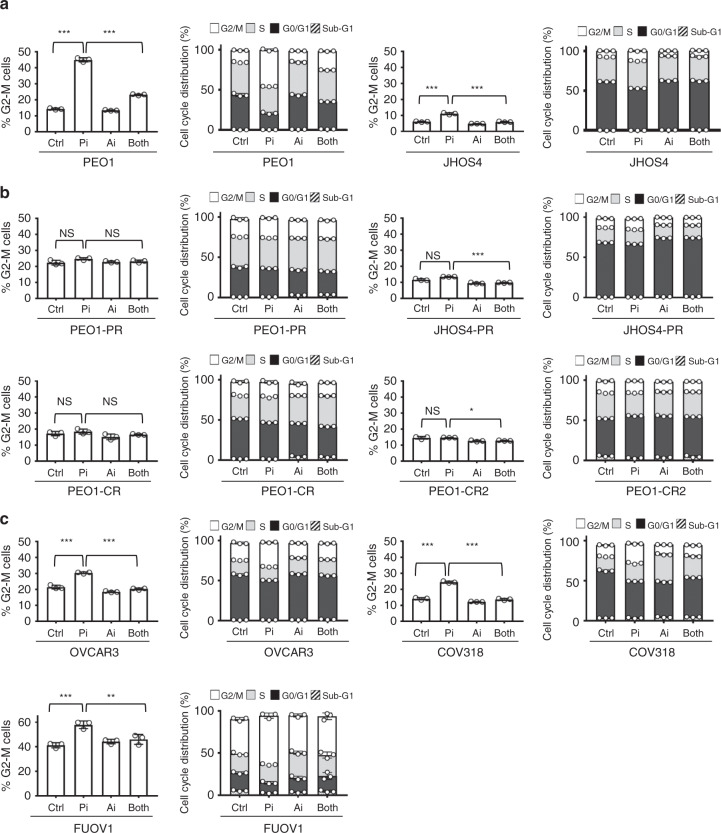
Fig. 3. Treatment effects on cell cycle in acquired PARPi and platinum-resistant cells.
a–c Parental BRCAMUT (PEO1, JHOS4) (a), acquired PARPi and platinum-resistant (PEO-PR, JHOS4-PR, PEO1-CR, and PEO1-CR2) (b), and platinum-resistant CCNE1AMP (OVCAR3, COV318, and FUOV1) (c), cells were treated with PARPi (1 μM for PEO1, JHOS4, PEO-PR, JHOS4-PR, PEO1-CR, PEO1-CR2, and OVCAR3; 2 μM for COV318 and FUOV1) and ATRi (1 μM for all cell lines) monotherapy and their combination, and then evaluated for cell-cycle by flow cytometry; G2-M phase changes (left panel) and cell-cycle phase distribution at 24 h (right panel) are shown. In parental BRCA1/2MUT PARPi-sensitive cells, there was a significant increase in G2-M with PARPi treatment that was overcome with the addition of ATRi treatment (PEO1 and JHOS4, P < 0.0001 Control vs PARPi and PARPi vs Both). In platinum-resistant, CCNE1AMP (OVCAR3, COV318, and FUOV1) cells, there was a significant increase in G2-M with PARPi treatment that was overcome with the addition of ATRi (OVCAR3 and COV318, P < 0.0001 Control vs PARPi and PARPi vs Both; FUOV1, P = 0.0005 Control vs PARPi, P = 0.004 PARPi vs Both). In the acquired PARPi and platinum-resistant cells, effects of PARPi treatment on G2/M were insignificant (P > 0.05) and with the addition of ATRi, the effects on G2-M were less striking as in parental and CCNE1AMP lines (P > 0.05 except P < 0.0001 for JHOS4-PR and P = 0.01 for PEO1-CR2). The data are presented as mean ± SD (n = 3 biologically independent samples). Individual samples are presented as data points overlaying bar grafts. The data were analyzed with one-way ANOVA followed by Tukey’s test. ***P < 0.001, **P < 0.01, *P < 0.05, NS = not significant. Source data are provided as a source data file.

