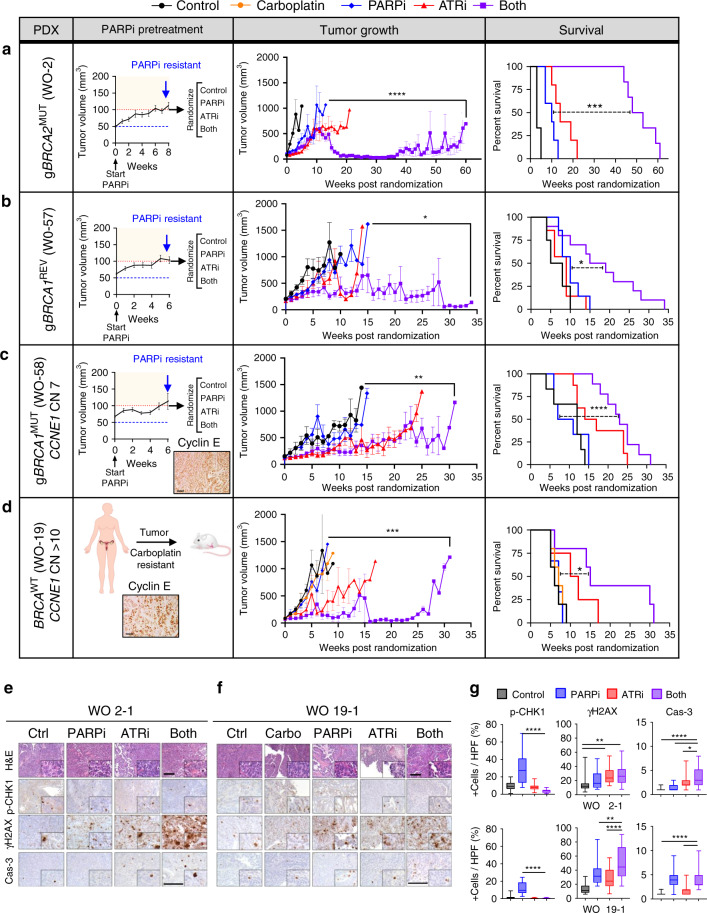
Fig. 6. Combination effects of PARPi–ATRi in drug-resistant ovarian cancer PDXs.
a–d PARPi pretreatment tumor growth curve (left), tumor volume growth curve (middle) and survival by Kaplan–Meier analysis (right) after randomization. a WO-2PR was from a gBRCA2 mutation carrier whose PDXs were treated with olaparib until progression. Treatment groups: (1) control (n = 3), (2) PARPi 100 mg/kg/day OG 6 days weekly (n = 5), (3) ATRi 50 mg/kg/day OG 5 days weekly (n = 5), (4) PARPi 50+ATRi 50 mg/kg/day OG 5 days weekly (n = 6). Due to progression in combination group by week 10, PARPi was increased to 75 mg/kg/day 6 days weekly. b WO-57 was from a PARPi-resistant gBRCA1 mutation carrier. Treatment groups: (1) control (n = 4), (2) PARPi 75 mg/kg/day OG 6 days weekly (n = 7), (3) ATRi 40 mg/kg/day OG 5 days weekly (n = 7), (4) Both (n = 10). c WO-58 was from a PARPi-resistant gBRCA1 mutation carrier with elevated CCNE1 copy number and protein. Treatment groups similar to (b): (1) control (n = 6), (2) PARPi (n = 6), (3) ATRi (n = 8), (4) Both (n = 9). d WO-19 was from a platinum-resistant, BRCAWT patient with CCNE1 amplification and protein overexpression by IHC magnification ×20. Scale bar = 50 μm. Treatment groups: (1) control (n = 5), (2) carboplatin 30 mg/kg IP weekly (n = 5), (3) PARPi 75 mg/kg/day OG 5 days weekly (n = 3), (4) ATRi 50 mg/kg/day OG 5 days weekly (n = 4), (5) Both (n = 6). Tumor growth shown is mean ± SEM. Longitudinal analysis by Linear Mixed-Effects modeling with type II ANOVA and pairwise comparisons across groups. Survival is shown by Kaplan–Meier curve using the Mantel-Cox log-rank test. P values provided in Supplementary Fig. 8. e–g H&E 10× and IHC 20× with 40× insets of pCHK1(S345), γH2AX, and cleaved-caspase-3 in WO-2PR and WO-19 PDXs at 2 weeks post-randomization. In box plots, bounds of boxes show interquartile range, whiskers show maximum and minimum, center lines indicate median. One-way ANOVA followed by Tukeys multiple comparison test for (e–g) (n = 27 HPF per group n = 3 mice, 9 HPF per tumor). ****P < 0.0001, WO-2 γH2AX P = 0.0039 (top), 0.0072 (bottom), cleaved-caspase-3 P = 0.0118, WO-19 γH2AX P = 0.0082. Scale bar = 100 μm. ****P < 0.0001, ***P < 0.001, **P < 0.01, *P < 0.05. Data are provided as a source data file.

