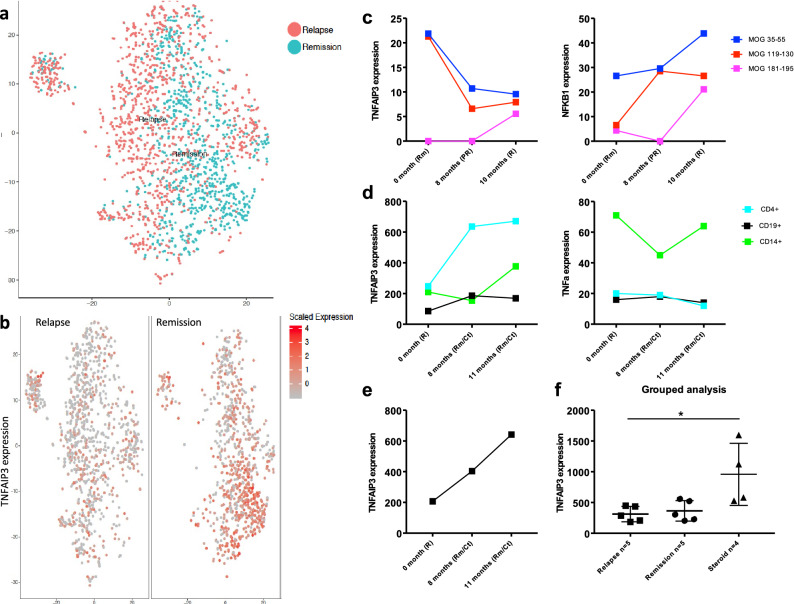
Figure 3.
Gene expression analysis in PBMCs from MOG-AAD patients: Single cell RNA sequencing (inDrop) was performed on an untreated MOG-AAD patient#1 with 2 longitudinal samples, (1) Remission (MOG-AAD#1.2) and (2) Pre-relapse (MOG-AAD#1.3) as described in Materials and Methods. cDNA libraries were sequenced using the Illumina NextSeq 500 platform and analyzed following V3 Indrop criteria. After sequencing the raw BCL files were demultiplexed using bcl2fastq software by illumina (https://support.illumina.com/sequencing/sequencing_software/bcl2fastq-conversion-software.html). Reads obtained from bcl2fastq were further processed using the single-cell RNA-seq pipeline of the bcbio-nextgen (https://bcbio-nextgen.readthedocs.io/en/latest/contents/pipelines.html#single-cell-rna-seq) software suite. The scaled data was further clustered using Seurat and visualized using TSNE (https://www.biorxiv.org/content/early/2018/11/02/460147). A Cluster analysis of a relapse and remission sample. B Differential expression of TNFAIP3 in the relapse and remission sample by single cell sequencing. Digital Gene Expression (DGE) sequencing was performed on an untreated MOG-AAD patient#1 with 3 longitudinal samples, (1) Rm (remission, MOG-AA#1.2), (2) PR (pre-relapse, MOG-AAD#1.3), and (3) R (relapse, MOG-AAD#1.4) as described in Materials and Methods. Raw BCL files generated through sequencing were further de-multiplexed using Picard (https://github.com/broadinstitute/picard) and the resulting FASTQ files where aligned to the human reference genome (GRCh38) using the STAR v2.4.2a52 aligner. Further QC was done using the RNA-seQC53 and transcript counts were produced using feature Counts function of the Subread package54. Data was normalized using the DESeq2 package55 and the graphs were made using GraphPadPrism version 8.4.2 (464). C TNFAIP3 and NFκβ1 expression by DGE sequencing. NanoString Gene Expression Assay was performed on a MOG-AAD patient#2 with 3 longitudinal samples, (1) untreated R (relapse, MOG-AAD#2.1), (2) 8 months Rm/Ct (mycophenolate mofetil treated at remission, MOG-AAD#2.2), and (3) 11 months Rm/Ct (mycophenolate mofetil treated at remission, MOG-AAD#2.3) as described in Materials and Methods. Data were normalized and analyzed using nSolver software via the geometric mean of included housekeeping genes. The graphs were made using GraphPadPrism version 8.4.2 (464). D TNFAIP3 and TNF-α expression by NanoString Gene Expression Assay. qPCR was performed on CD4+ T cells from 7 MOG-AAD patients with longitudinal samples as described in Materials and Methods. It also included MOG-AAD patient#2 with 3 longitudinal samples as previously used for NanoString gene expression assay. The graphs were made using GraphPadPrism version 8.4.2 (464). E TNFAIP3 expression in MOG-AAD patient#2 by qPCR. F Grouped analysis of TNFAIP3 expression in relapse samples, remission samples and samples treated with corticosteroids by qPCR. Relapse n = 5, Remission n = 5, Steroid n = 4, Ordinary 1-way ANOVA; P = 0.0137.

