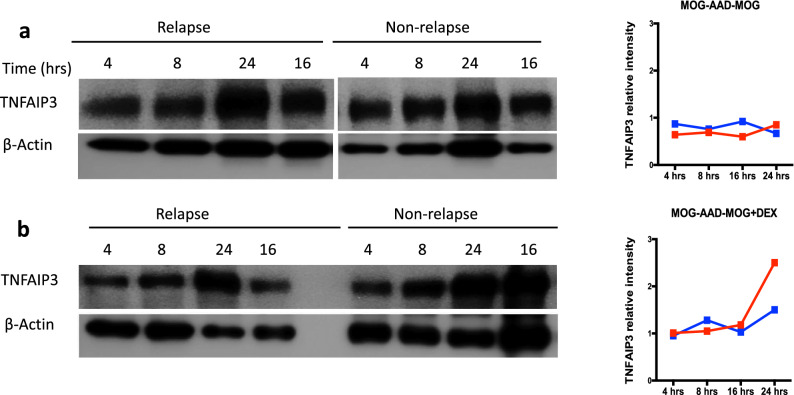
Figure 4.
TNFAIP3 protein expression in relapse and non-relapse samples from an untreated MOG-AAD patient: PBMCs from a MOG-AAD patient#3 at a relapse (MOG-AAD#3.1) and non-relapse (MOG-AAD#3.2) time point were cultured under different conditions, analyzed by SDS-PAGE and followed by western blot for TNFAIP3 at the indicated time points (hours) as described in Materials and Methods. A MOG antigen stimulation at 1 μg/ml (peptide cocktail comprising of MOG p1-20, p35-55, p119-130, p181-195 and p186-200). B MOG antigen + Dexamethasone stimulation at 1 μg + 100 nm. Representative Western blot images are shown on left and protein bands quantified using ImageJ version 1.53b and normalized to β-actin are shown on the right. The graphs were made using GraphPadPrism version 8.4.2 (464). Full-length blots/gels for TNFAIP3 and β-Actin are presented in Supplementary Fig. 5.

