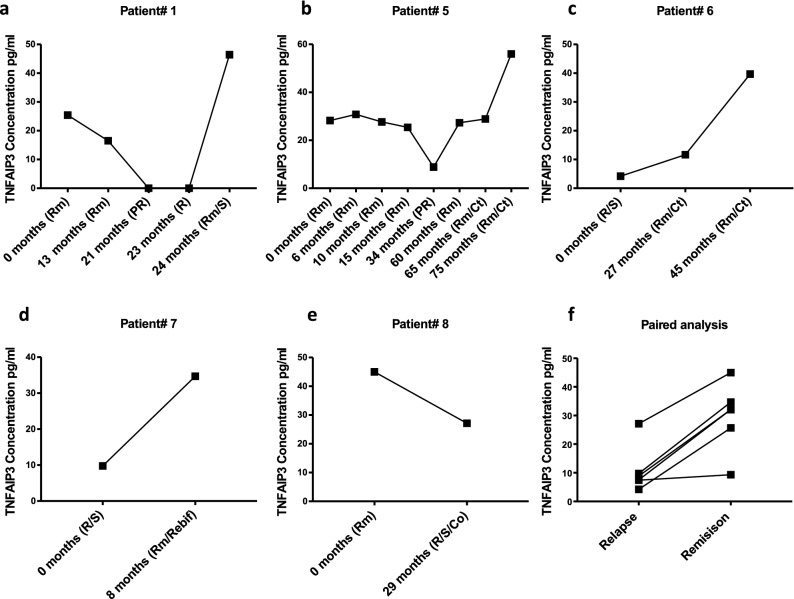
Figure 5.
Serum levels of TNFAIP3 in indicated longitudinal samples of MOG-AAD patients determined by ELISA: The graphs were made using GraphPadPrism version 8.4.2 (464) A TNFAIP3 levels in MOG-AAD patient#1 with 5 longitudinal samples, (1) Rm (remission, MOG-AAD#1.1), (2) Rm (remission, MOG-AAD#1.2), (3) PR (pre-relapse, MOG-AAD#1.3), (4) R (relapse, MOG-AAD#1.4), and (5) Rm/S (remission treated with steroid, MOG-AAD#1.5). B TNFAIP3 levels in MOG-AAD patient#5 with 8 longitudinal samples, (1) Rm (remission, MOG-AAD#5.1), (2) Rm (remission, MOG-AAD#5.2), (3) Rm (remission, MOG-AAD#5.3), (4) Rm (remission, MOG-AAD#5.4), (5) PR (pre-relapse, MOG-AAD#5.5), (6) Rm (remission, MOG-AAD#5.6), (7) Rm/Ct (mycophenolate mofetil treated at remission, MOG-AAD#5.7), and (8) Rm/Ct (mycophenolate mofetil treated at remission, MOG-AAD#5.8). C TNFAIP3 levels in MOG-AAD patient#6 with 3 longitudinal samples, (1) R/S (relapse treated with steroid, MOG-AAD#6.1), (2) Rm/Ct (mycophenolate mofetil treated at remission, MOG-AAD#6.2), and (3) Rm/Ct (mycophenolate mofetil treated at remission, MOG-AAD#6.3). D TNFAIP3 levels in MOG-AAD patient#7 with 2 longitudinal samples, (1) R/S (relapse treated with steroid, MOG-AAD#7.1), and (2) Rm/Rebif (remission treated with interferon beta-1a, MOG-AAD#7.2). E TNFAIP3 levels in MOG-AAD patient#8 with 2 longitudinal samples, (1) Rm (remission, MOG-AAD#8.1) and (2) R/S/Co (remission treated with steroid and Glatiramer acetate, MOG-AAD#8.2). F Mixed model paired analysis compared MOG-AAD patients, who had, both, relapse and remission samples. Relapse n = 8, Remission n = 22. The comparison between the relapse and remission group was done using Nonlinear Mixed-Effects Models library in R (nlme).

