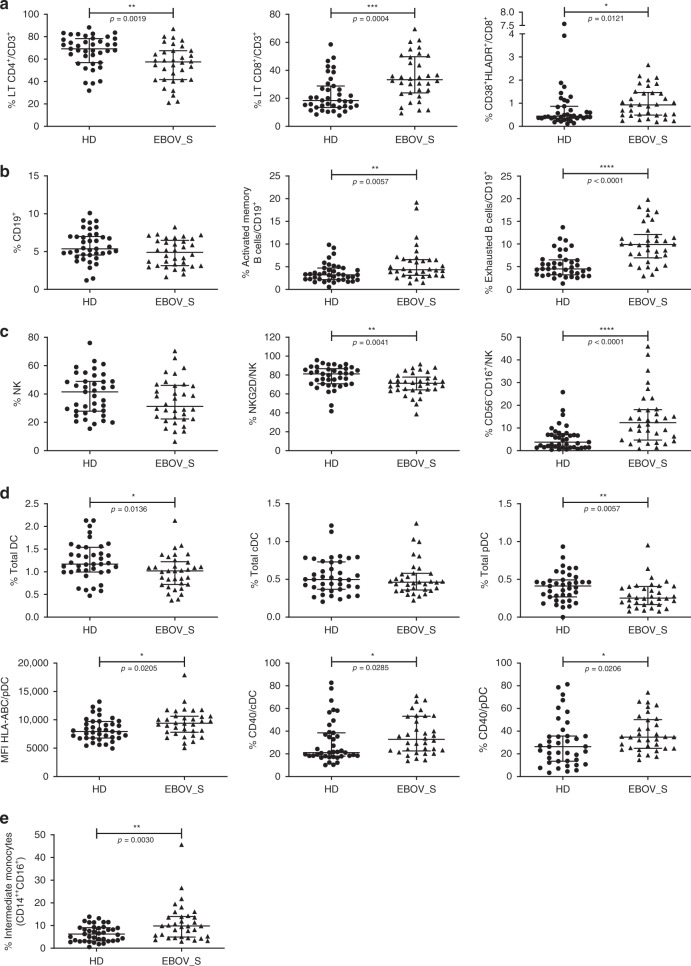
Fig. 2. Modifications in immune cell subset frequencies in EBOV_S.
Cumulative T cell frequency and CD8 T cell activation analyses (a), B cell subsets (b), NK cell subsets (c), dendritic cell subsets and activation (d), and monocyte subsets (e) from n = 34 EBOV_S and n = 39 HDs. DC gating strategy is shown in Supplementary Fig. 4. The differences between HDs and EBOV_S were evaluated with nonparametric Mann–Whitney U tests. Median values ± IQR are shown. Source data are provided as a Source Data file.

