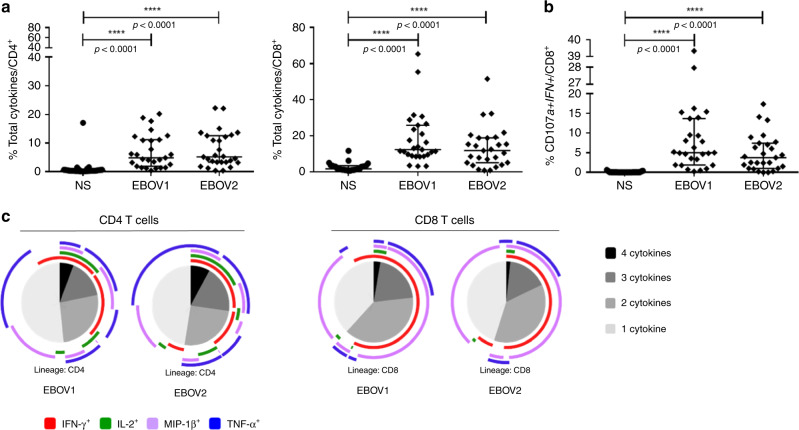
Fig. 3. Robust and polyfunctional responses in EBOV_S.
EBOV GP-specific CD4+ T cell (left panel) and CD8+ T cell (right panel) responses of EBOV_S (n = 27) after 9 days of EBOV GP-specific (EBOV1 and EBOV2 peptide pools) T cell expansion in vitro (all cytokines) (a). Analysis of the co-expression of CD107a and IFN-γ by EBOV GP-specific CD8 T cells from EBOV_S (n = 27) after 9 days of antigen-specific T cell expansion in vitro (b). Median values ± IQR are shown, and Friedman’s test was used for comparisons. Functional composition of EBOV GP-specific CD4+ and CD8+ T cell responses (c). Responses are color coded according to the combinations of cytokines produced. The arcs identify cytokine-producing subsets (IFN-γ, IL-2, MIP-1β, and TNF) within the CD4+ and CD8+ T cell populations. Source data are provided as a Source Data file.

