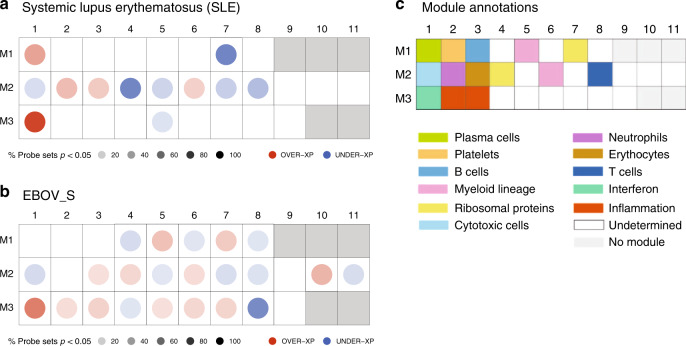
Fig. 6. Similarities between EBOV_S and SLE and acute EBOV immune signatures.
Mapping global transcriptional changes with the use of Chaussabel’s modules28 for which at least 15% of the transcripts are significantly changed between controls (n = 12) and patients with SLE (n = 22) (a) or HDs (n = 33) and EBOV_S (n = 26) (p value <0.05 for the Mann–Whitney/Wilcoxon’s test) (b). Module annotations (c). Spots indicate the proportion of genes significantly changed for each module (p value <0.05 for SLE as per Chaussabel et al.28, fold change >1.5, and FDR <0.05 for EBOV_S). Coordinates indicate module ID (e.g., M2.8 is row M2, column 8). Overexpressed modules are indicated in red and underexpressed modules are indicated in blue, in comparison to control groups. Functional interpretation is indicated on a grid by a color code28.

