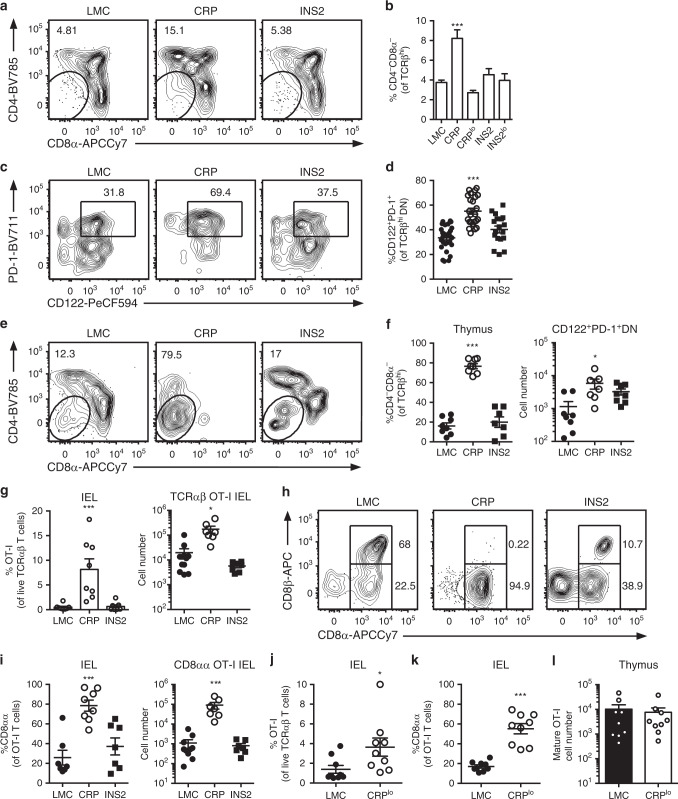
Fig. 3. mTEClo-biased expression of USA supports MHC class I-restricted TCRαβ+ CD8αα intraepithelial lymphocyte differentiation.
a Representative flow plots of CD4 and CD8 on TCRβhi OT-I thymocytes, and b proportion of CD4−CD8− cells among live TCRβhi OT-I thymocytes 24 h after overlay on the indicated thymic slices (mean ± SEM, n = 70 LMC, 30 CRP, 12 CRPlo, 27 INS2, 12 INS2lo). c Representative flow plot of PD-1 and CD122 and d proportion of CD122+PD-1+ cells among CD4−CD8−TCRβhi OT-I T thymocytes 24 h after overlay on the indicated thymic slices (mean ± SEM, n = 30 LMC, 24 CRP, 18 INS2). e–l Littermate control (LMC), CRP, CRPlo and INS2 Tg mice (CD45.2) were irradiated and reconstituted with 1% OT-I (CD45.1) and 99% WT (CD45.1.2) bone marrow. OT-I cells in the indicated hosts were analyzed. e Representative flow plot of CD4 and CD8 expression on TCRβhi OT-I thymocytes. f Proportion of CD4−CD8− cells within the TCRβhi OT-I thymocyte population and absolute number of PD1+CD122+TCRβhi CD4−CD8− OT-I thymocytes (mean ± SEM, left panel: n = 8 LMC, 8 CRP, 7 INS2, right panel: n = 8 LMC, 7 CRP, 8 INS2). g Proportion and cell number of OT-I T cells of TCRαβ intraepithelial lymphocytes (IEL) (mean ± SEM, left panel: n = 8 LMC, 8 CRP, 7 INS2, right panel: n = 10 LMC, 8 CRP, 8 INS2). h Representative flow plot of CD8α and CD8β staining on the OT-I T cells. i The proportion and cell number of TCRαβ+ CD8αα IEL among the OT-I T cells (mean ± SEM, left panel: n = 8 LMC, 8 CRP, 7 INS2, right panel: n = 10 LMC, 8 CRP, 8 INS2). j Proportion of OT-I T cells within the live TCRαβ+ IEL. k Proportion of TCRαβ+ CD8αα of the OT-I T cells. l Proportion of mature TCRβhi CD8+ SP OT-I thymocytes among total live cells in the thymus (mean ± SEM, n = 9 mice per group). Data are from at least two independent experiments. The p-values for panels b, d, f, g and i were calculated by Kruskal–Wallis test followed by Dunn’s post-hoc comparisons to LMC, two-sided. For panels j-l a two-tailed Mann-Whitney U test was performed. *p < 0.05, ***p < 0.001 relative to LMC. Source data are provided as a Source Data file.

