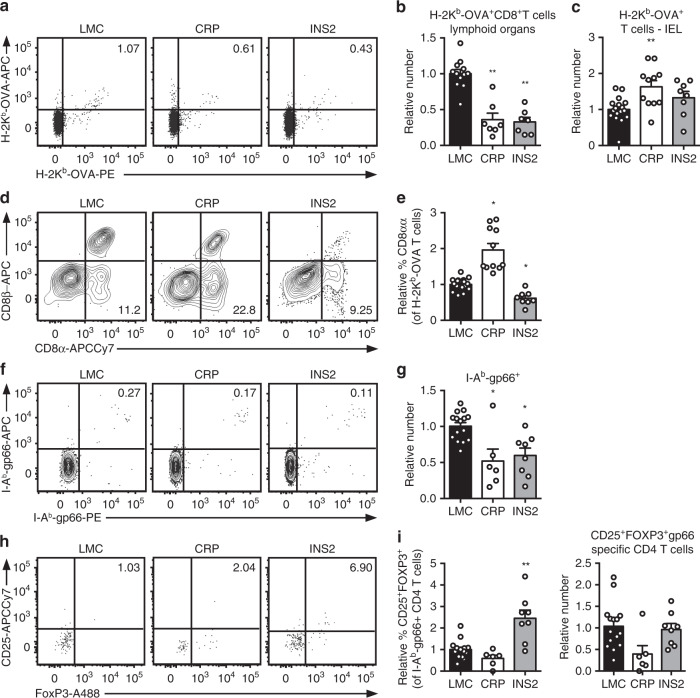
Fig. 5. TRA expression by distinct mTEC compartments impacts the mode of tolerance induction in the polyclonal T cell repertoire in naïve mice.
a Representative flow plots of H-2Kb-OVA tetramer on pooled peripheral lymph nodes and spleen cells from naïve mice after enrichment, gated on live TCRαβ+ CD8+ T cells. Relative number of H-2Kb-OVA-specific TCRαβ+ CD8+ T cells in the peripheral secondary lymphoid organs (mean ± SEM, n = 12 LMC, 7 CRP, 7 INS2) (b) and intraepithelial lymphocytes (IEL) (mean ± SEM, n = 17 LMC, 11 CRP, 8 INS2) (c) from CRP and INS2 Tg mice as compared to their respective littermate controls (LMC). d Representative flow plot of CD8α and CD8β and e relative proportion of TCRαβ+ CD8αα within the H-2Kb-OVA tetramer double positive TCRαβ IEL of CRP and INS2 Tg mice as compared to their respective LMC (mean ± SEM, n = 17 LMC, 11 CRP, 8 INS2). f Representative flow plots of I-Ab-gp66 tetramer on pooled peripheral lymph nodes and spleen cells from naïve mice, gated on live TCRαβ+ CD4+ T cells. g Relative number of I-Ab-gp66 tetramer DP CD4+ T cells in the peripheral lymph nodes and the spleen of naïve mice. h Representative flow plots of CD25 and FoxP3, gated on live I-Ab-gp66 tetramer+ CD4+ T cells. i Relative proportion of CD25+FoxP3+ Treg of gp66-specific CD4+ T cells and relative number of gp66-specific CD4+CD25+FoxP3+ Treg from CRP and INS2 peripheral lymph nodes and spleen as compared to their respective LMC. Absolute numbers were normalized to LMC for each Tg line and in each experiment for the relative number calculation (g and i, mean ± SEM, n = 15 LMC, 6 CRP, 8 INS2). Data are pooled from at least two independent experiments. All the p values indicated are calculated by Kruskal–Wallis test followed by Dunn’s post-hoc comparisons to LMC. *p < 0.05, **p < 0.01 relative to LMC. Source data are provided as a Source Data file.

