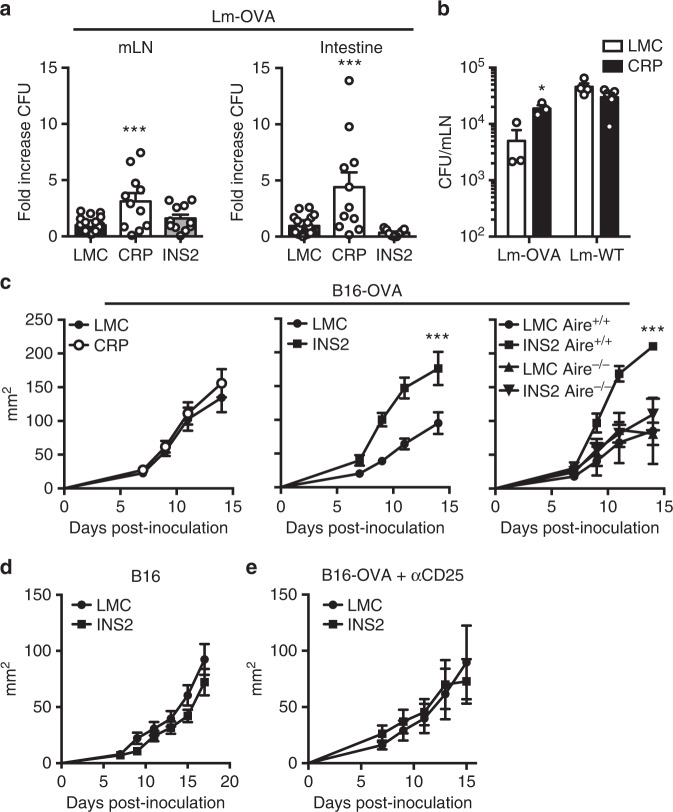
Fig. 7. Biased expression of TRA in distinct mTEC subsets differentially impacts control of bacterial infection and tumor growth.
Low-density OT-I hematopoietic chimeras were infected by oral gavage with Listeria monocytogenes OVA (Lm-OVA) (a, b) or Lm-WT (b) and euthanized 3 days post-infection to determine the number of Lm bacteria in the mesenteric lymph nodes (mLN) and the small intestine. The results are reported as fold increase in colony forming units (CFU) as compared to littermate control (LMC) mice (mean ± SEM, n = 20 LMC, 10 CRP, 10 INS2 mice) (a) and in CFU in the mLNs from the LMC and CRP Tg mice (mean ± SEM, Lm-OVA, n = 3 per group, Lm-WT, n = 4 per group) (b). B16-OVA c (mean ± SEM, n = 8 CRP LMC, 10 CRP Tg, 10 INS2 LMC, 10 INS2 Tg, 2 LMC Aire+/+, 3 Aire+/+ INS2, 5 Aire−/− LMC, 4 Aire−/− INS2) or B16 d (mean ± SEM, n = 7 per group) cells were inoculated subcutaneously, and tumor growth was followed every 2 days by measuring tumor diameter and calculating the tumor area in the indicated mice. e INS2 Tg mice were injected with anti-CD25 depleting antibody 4 days and 1 day before B16-OVA cell inoculation, and tumor growth was measured every 2 days starting on day 7 post-inoculation (mean ± SEM, n = 10 per group). Data are pooled from two independent experiments. Statistical analyses were performed by Kruskal–Wallis test followed by Dunn’s post-hoc comparisons to LMC, two-sided a, a two-tailed Mann–Whitney U test b and linear mixed-effects modeling c–e. *p < 0.05, ***p < 0.001 relative to LMC. Source data are provided as a Source Data file.

