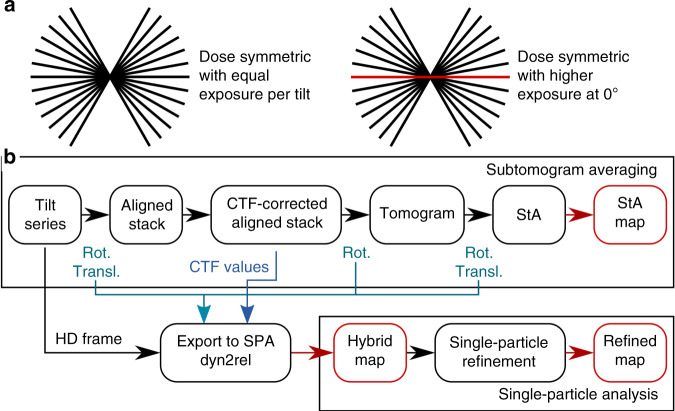
Fig. 1. Scheme of the Hybrid StA-SPA workflow.
a A schematic depicting the distribution of dose in the dose-symmetric scheme20 with uniform dose distribution (left) and with an increased exposure for the untilted image shown in red (right panel). b Data flow diagram for conventional and hybrid StA, black boxes correspond to the intermediate steps, red boxes indicate the output maps, blue arrows indicate geometric transforms performed between the processing steps and the CTF information which are exported for hybrid StA processing.

