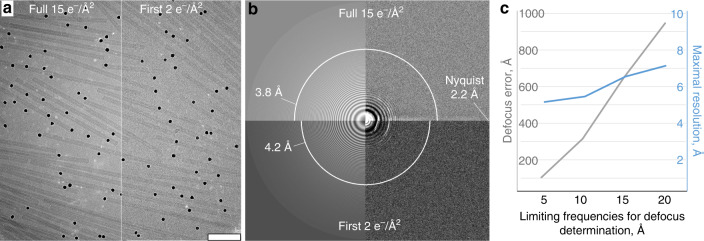
Fig. 2. Improved CTF determination for the Hybrid StA.
a A representative micrograph of a 15 e−/Å2, 0° tilt image (left) shown together with the first 2 e−/Å2 of the same image (right). Scale bar: 100 nm. b The detected Thon rings for the two images in (a). The white arcs represent the maximum resolution reported by Gctf38. c Relationship between the maximum frequencies used for defocus determination (X-axis) and the precision of defocus estimation (Y-axis). Grey line: error in defocus determination with limited frequencies compared to the defocus determination with the full range of frequencies; blue line: maximal resolution up to which the estimated CTF fits with the data, as reported by Gctf38.

