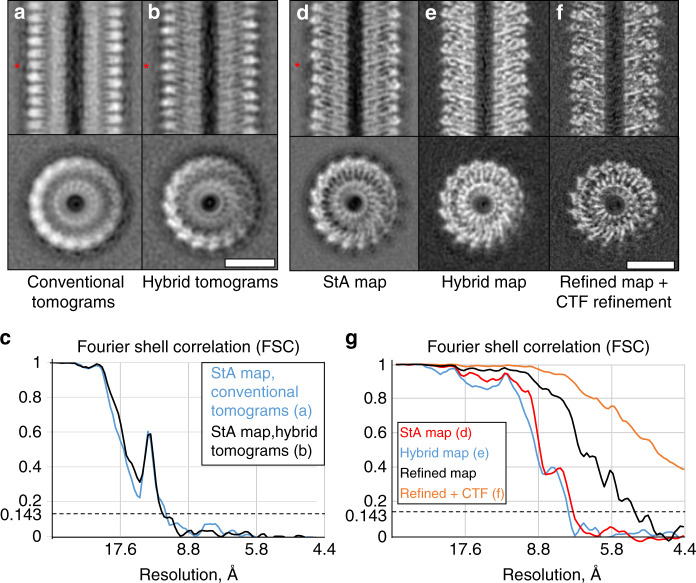
Fig. 3. Resolution improvement by the application of hStA to TMV.
a–c Structures of TMV (a, b) and the corresponding FSC curves (c) as processed by the conventional subtomogram averaging workflow. The dataset in a was recorded using a conventional dose-symmetric scheme and in b using the proposed hybrid scheme. Note the “halos” observed next to the density in e, f and marked with the asterisks. d–g Processing of a larger dataset of hybrid tomograms of TMV: d conventional StA map; e Hybrid map, reconstruction only from the high-dose image; f and the refined map with the refined CTF; g the corresponding FSC curves. Scale bars: 10 nm.

