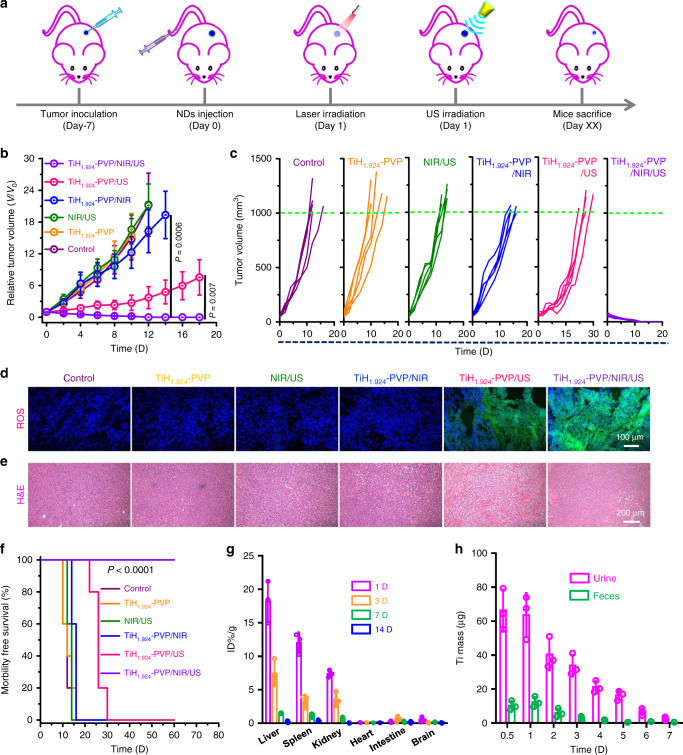
Fig. 6. In vivo mild PTT-enhanced SDT via TiH1.924-PVP.
a Schematic illustration to show the combination of PTT and SDT with TiH1.924-PVP nanodots. b, c Average tumor growth curves (b) and individual tumor growth curves (c) on mice after different treatments, including control, TiH1.924-PVP, NIR/US, TiH1.924-PVP/NIR, TiH1.924-PVP/US, and TiH1.924-PVP/NIR/US (n = 5 biologically independent mice). d Micrograph of DCFH-DA stained tumor slices collected for mice receiving different treatments. e H&E stained tumor slices collected from different treatment groups. f Survival curves of mice after various treatments. g Biodistribution of TiH1.924-PVP post i.v. injection in mice on different days (n = 3 biologically independent mice). h The detected Ti mass in urine and feces at different time points post i.v. injection of TiH1.924-PVP (n = 3 biologically independent mice). The Ti contents were measured by ICP-OES. TiH1.924-PVP: 20 mg kg−1; NIR laser: 1064 nm, 0.8 W cm−2, 20 min, T < 45 °C; US irradiation: 40 kHz, 3 W cm−2, 1 min per cycle, 20 cycles. A representative image of three biological replicates from each group is shown in d, e. Data are presented as mean values ± SD. Statistical significance was calculated with two-tailed Student’s t test (b) and Logrank test (two-sided) for trend (f).

