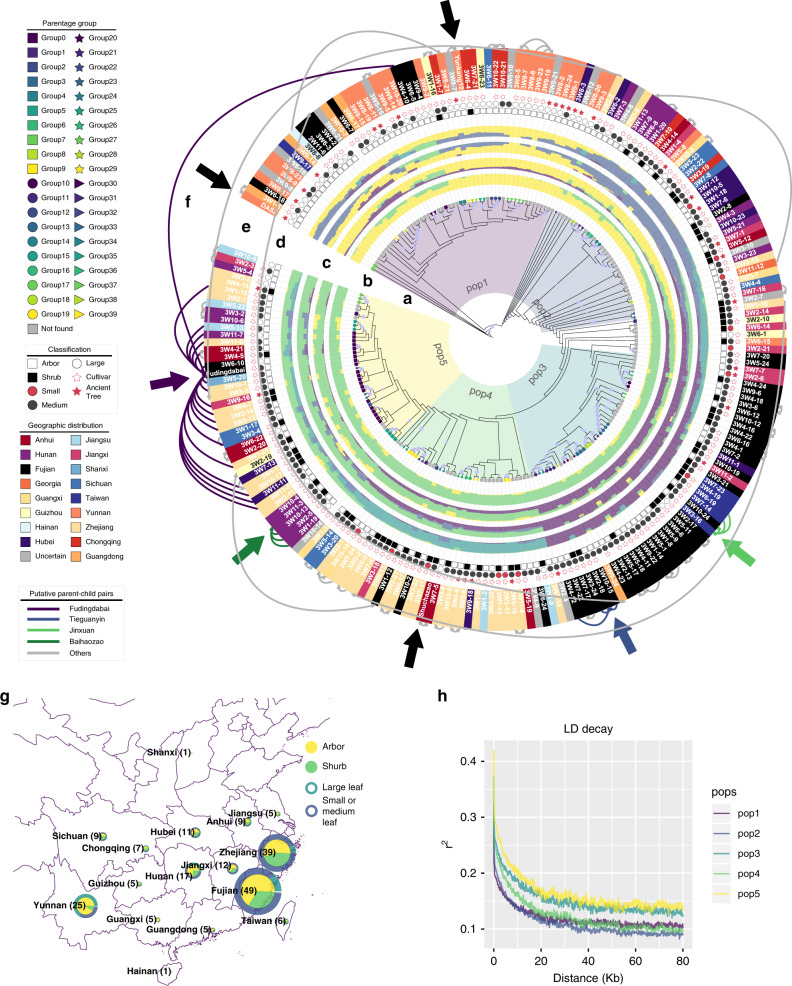
Fig. 2. Population genetic analysis of 221 tea accessions.
a Phylogenetic tree of 221 tea accessions. Circles in the middle of branches indicate the bootstrap values > 50 and the size of circles represent the values ranging from 50 to 100. The five colors in the background are the five subpopulations defined based on the phylogenetic tree and population structures. b Parentage analysis of 221 tea accessions. Different shapes and colors of nodes represent different parentage groups and the legend is shown in the left panel. Detailed information of these groups is presented in Supplementary Data 7. c Barplot of population structures. The inner layer to outside layer indicates the K from 2 to 5, respectively. Different colors represent different populations. d Classes of 221 tea accessions. Hollow and solid squares show the arbor or shrub of accessions, respectively. Hollow and black and red circles exhibit different leaf size and five-pointed stars represent the ancient trees or cultivars. Blankness indicates that the information is missing. Detailed legend is shown in left. e Geographic distribution of tea accessions. Colors represent the origins of 221 accessions. f Potential pedigrees of tea accessions. Black arrows indicate the three sequenced accessions. Colorful arrows represent the potential key contributors identified in this study. Links show the putative parent-children relationships. g Map of the geographic distribution of tea accessions. Radiuses of pie plots represent the numbers of accessions in one province of china. Inner parts of pie plots indicate the ratio of arbor and shrub accessions. Outside layers of pie plots show the ratio of different leaf size. h LD decay of five subpopulations. Different colored lines show different subpopulations. Source data underlying a, c, f, h are provided as a Source Data file.

