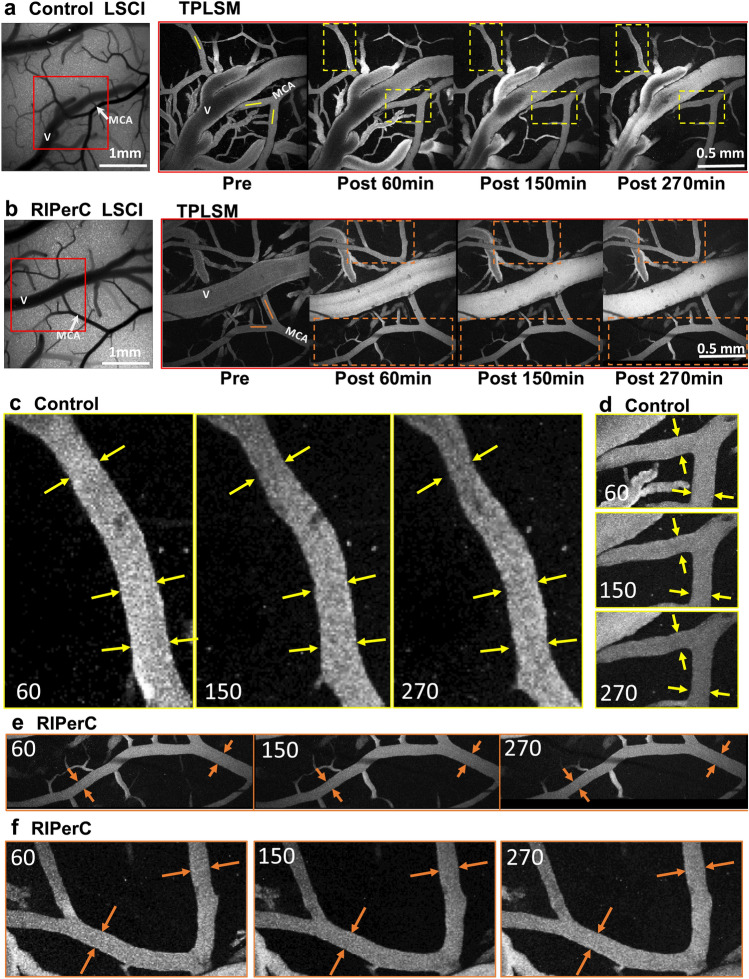
Figure 3.
Representative images from TPLSM of collateral blood flow after dMCAO. (a,b) Representative images of a control rat (a) and RIPerC-treated rat (b). Panels of TPLSM images on the right show maximum intensity projections from region demarcated with rectangular box in LSCI images. Scale bar, 1 mm. (c,d) Magnified images showing vessels demarcated by the yellow boxes for the control rat shown in (a). Yellow arrows denote vessel diameter 60 min after dMCAO, and are superimposed on the same vessel and region 150 and 270 min after dMCAO. Clear constriction of vessel lumen diameter is apparent in control rats. (e,f) Magnified images of vessels demarcated by the orange boxes in the RIPerC treated rat in (b). Again, orange arrows show vessel diameter at 60 min after dMCAO and are repeated in images acquired 150 and 270 min after ischemic onset. With RIPerC, vessel diameter is maintained throughout the imaging period.

