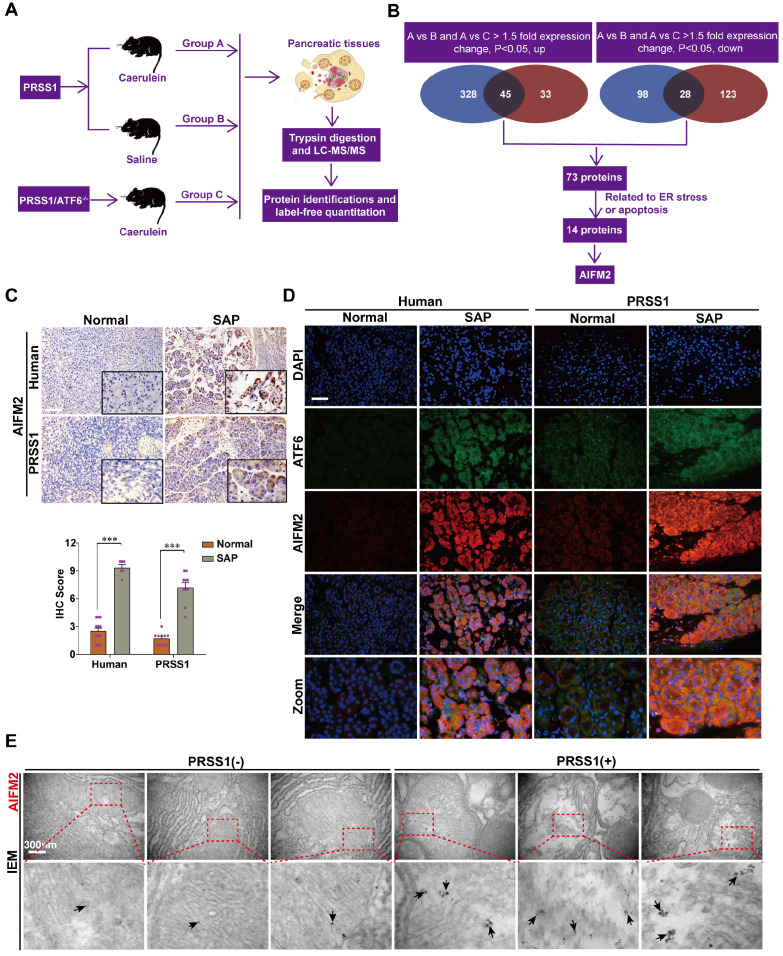
Figure 3.
Proteomic analysis to identify potential regulatory proteins related to SAP progression. (A) Schematic representation of the protocol followed for proteomic analysis. (B) Schematic diagram of proteomic screening process to identify target proteins related to SAP progression. (C) Representative images of immunohistochemical staining of AIFM2 in pancreatic tissues from humans and PRSS1Tg mice. (D) Immunofluorescence staining to detect the localization of ATF6 and AIFM2 in human and PRSS1Tg mouse pancreatic tissues. (E) IEM analysis of AIFM2 localization and expression; black arrows (↑): representative gold nanoparticles. The data are presented as the means ± SDs; ns, no significant difference; * p ≤ 0.05, ** p ≤ 0.01, *** p ≤ 0.001. Scale bars = 100 µm.

