Figure 8.
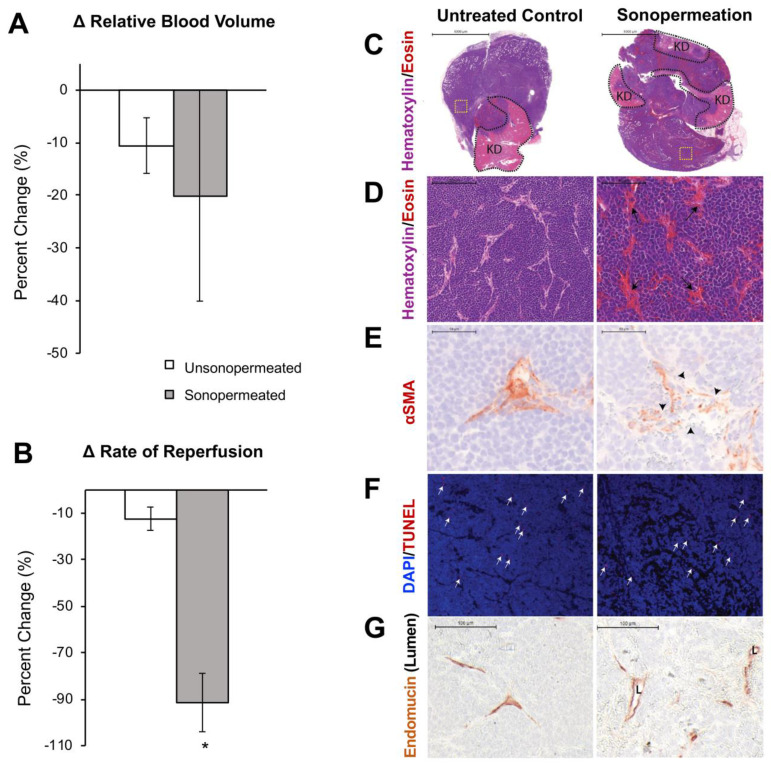
Effect of sonopermeation alone (no L-DOX) on qCEUS parameters and NGP tumoral vasculature 30 min post-treatment. (A) Change in RBV after sonopermeation within the sonopermeated tumor compared to unsonopermeated control region outside the tumor (see Figure 2 for ROI selection). (B) Change in RR after sonopermeation using the same ROIs. (C-G) Ex vivo analysis of NGP tumors harvested 30 min after sonopermeation alone (right column) or following no treatment (Untreated Control, left column). (C) Hematoxylin (blue) and eosin (pink-red) (top and middle rows) with remaining kidney (KD, light pink) highlighted by the dotted black line (top row) revealed no change in cell death as a result of sonopermeation (homogeneous blue staining). (D) 20x magnification (middle row) of an area away from normal kidney (yellow dotted square in top row) shows increased blood vessel diameter (black arrows) in the treated tumors compared to untreated controls. (E) Sonopermeation led to discontinuous pericyte coverage (black arrowheads) illustrated by interrupted alpha-smooth muscle actin immunostain (αSMA, third row). (F) TUNEL staining (red, white arrows) was used to detect cell death, which was minimally observed in untreated or sonopermeation alone mice. (G) Sonopermeation alone increases blood vessel dilation. Lumens (“L”) were measured using Pannoramic Viewer; the longest distance between Endomucin immunostained cells was measured, and over 100 measurements of randomized locations per tissue were analyzed (see Supplementary Figure 5). N = 3 mice per group.

