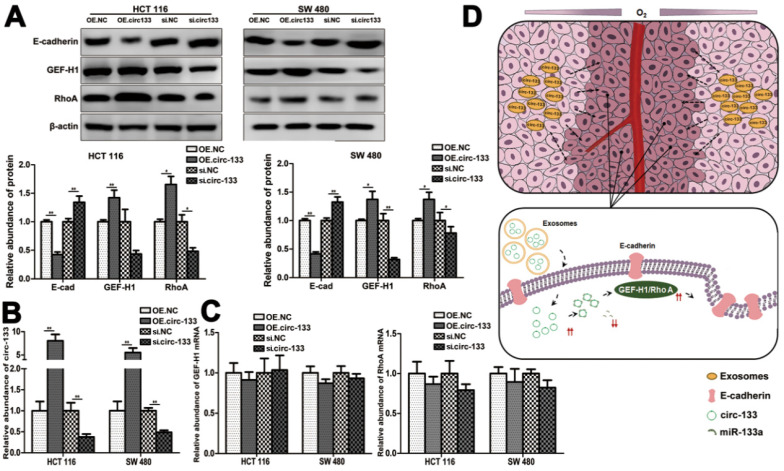
Figure 7.
A proposed mechanistic model about this study. (A) Associated proteins expression in each treatment groups (OE circ-133, OE NC, si-circ-133 and si-NC), (n=3). (B) The expression of circ-133 in each group, (n=3). (C) The level of GEF-H1 mRNA and RhoA mRNA in each treatment group, (n=3). (D) A proposed mechanistic model about this study.

