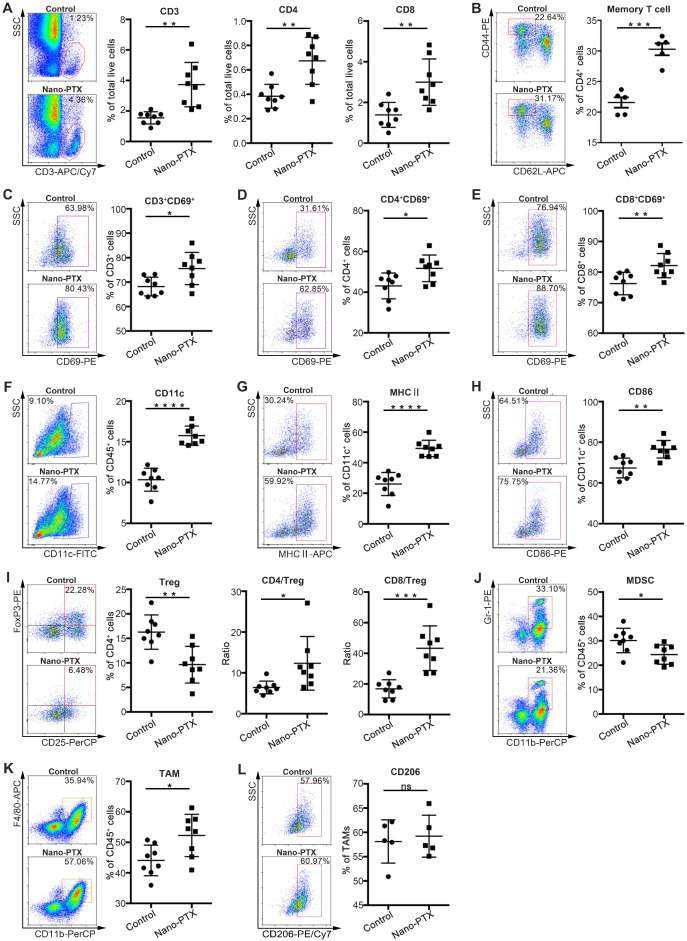
Figure 2.
Nano-PTX treatment increases immune cells infiltration and activation within tumor. Mice with established CT26 tumors were treated with nano-PTX (10 mg/kg) as described in Figure 5G. Tumor cells were harvested and analyzed by flow cytometry on day 20 (n = 8 mice per group). A-B The percentage of T cells (A) and memory T (CD4+CD44highCD62low/-) cells (B) were shown. C-E The activation status of T cell measured by CD69 expression. F-H The percentage of DCs (CD11c+) (F) and its activation status determined by the expression of MHCII (G) and CD86 (H). I The percentage of Tregs (CD4+CD25+FoxP3+) within tumors, and the ratios of CD4+ to Tregs and CD8+ to Tregs were shown. J The percentages of MDSCs. K-L The proportion of TAMs (CD11b+F4/80+) and M2 (CD11b+F4/80+CD206+) TAMs within tumors. Representative flow data was shown in left. Mean ±SEM was shown. * P < 0.05, ** P < 0.01, *** P < 0.001,**** P < 0.0001, ns (no statistical significance).

