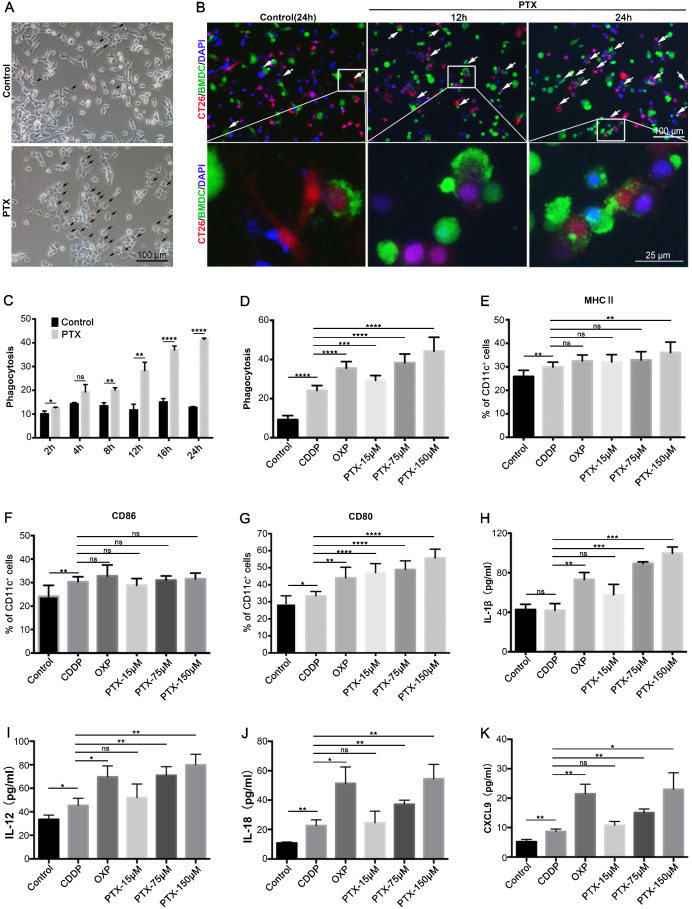
Figure 4.
PTX-treated tumor cells are readily phagocytosed by BMDCs. A Representative image of co-culture untreated (Control) or PTX-treated CT26 cells with BMDCs, the black arrow indicated the dying cell was phagocytosed by BMDCs (Scale bars, 100 µm). B Representative images of co-culture BMDCs (green) with PTX-treated CT26-RFP cells (red) at different time points, the white arrow indicated phagocytosis (Scale bar, 100 µm). An enlargement area was showed below (Scale bar, 25 µm). C-D The quantification of CT26 (RFP) cells phagocytosed by BMDCs (CFSE), n = 3 replicates. E-K CT26 cells were treated with CDDP (150 µM), OXP (300 µM) and PTX for 4 h and then co-cultured with BMDCs for an additional 24 h. The expression of MHCII (E), CD86 (F), and CD80 (G) on BMDCs was assessed by flow cytometry, n = 7 replicates; IL-1β (H), IL-12 (I), IL-18 (J), and CXCL9 (K) in the co-culture supernatant were determined by ELISA assay, n = 3 replicates. Mean ±SEM was shown. * P < 0.05, ** P < 0.01, *** P < 0.001, **** P < 0.0001, ns (no statistical significance).

