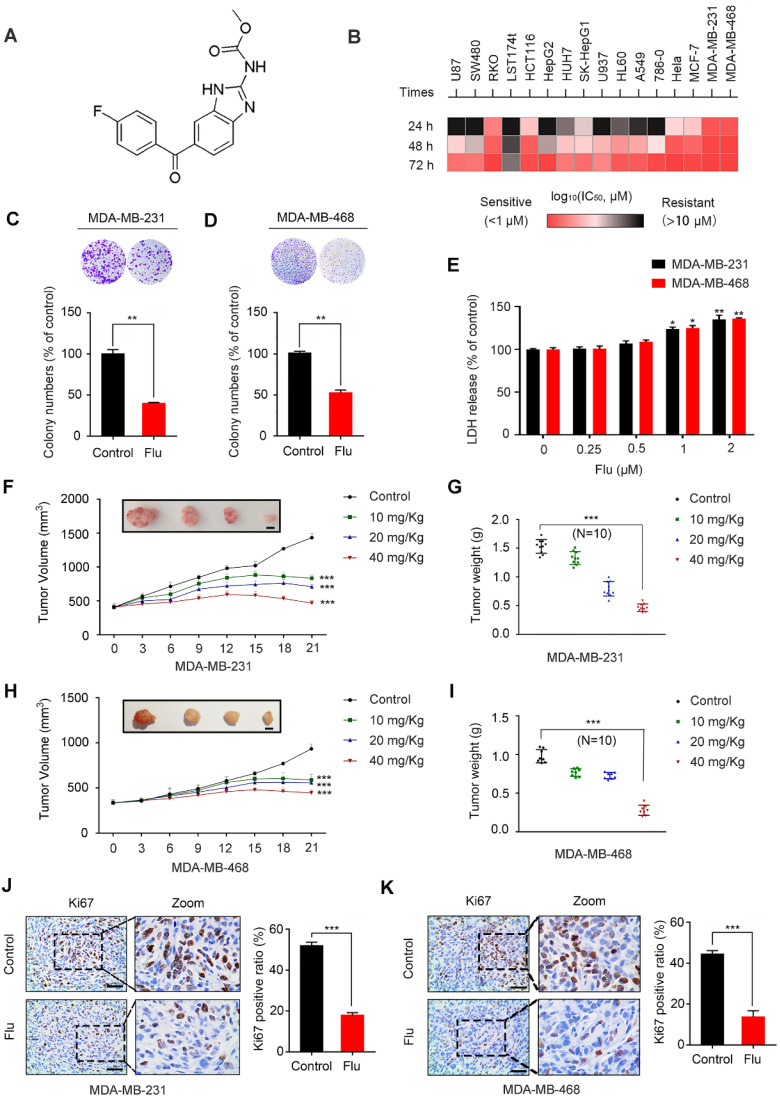
Figure 1.
Flubendazole inhibits TNBC in vitro and in vivo. (A) The chemical structure of flubendazole. (B) Heat map of mean IC50 values of flubendazole in multiple tumor cell lines at different times. Cell viabilities were measured by MTT assay, and the IC50 values were calculated by Prism 7.0. (C-D) Colony formation assay of MDA-MB-231 and MDA-MB-468 cells treated with or without flubendazole (0.5 µM). Representative images and quantification of colonies were shown. (E) LDH release assay of MDA-MB-231 and MDA-MB-468 cells treated with the indicated concentrations of flubendazole for 24 h. (F-I) The images of isolated tumors derived from mice and antitumor activities of flubendazole in representative MDA-MB-231 and MDA-MB-468 tumors from mice after vehicle and flubendazole treatment: (F and H) tumor volume and (G and I) tumor weight (n = 10), Scale bar, 0.5 cm. (J-K) The expression of Ki67 in representative MDA-MB-231 and MDA-MB-468 tumor sections of nude mice from vehicle and median dose (20 mg/Kg). Representative images and quantitative analysis of the percentage of positive ratios were shown. Scale bar, 40 µm. Data are expressed as mean ± SEM. All data were representative of at least three independent experiments. *, P < 0.05, **, P < 0.01, ***, P < 0.001. Statistical significance compared with respective control groups.

