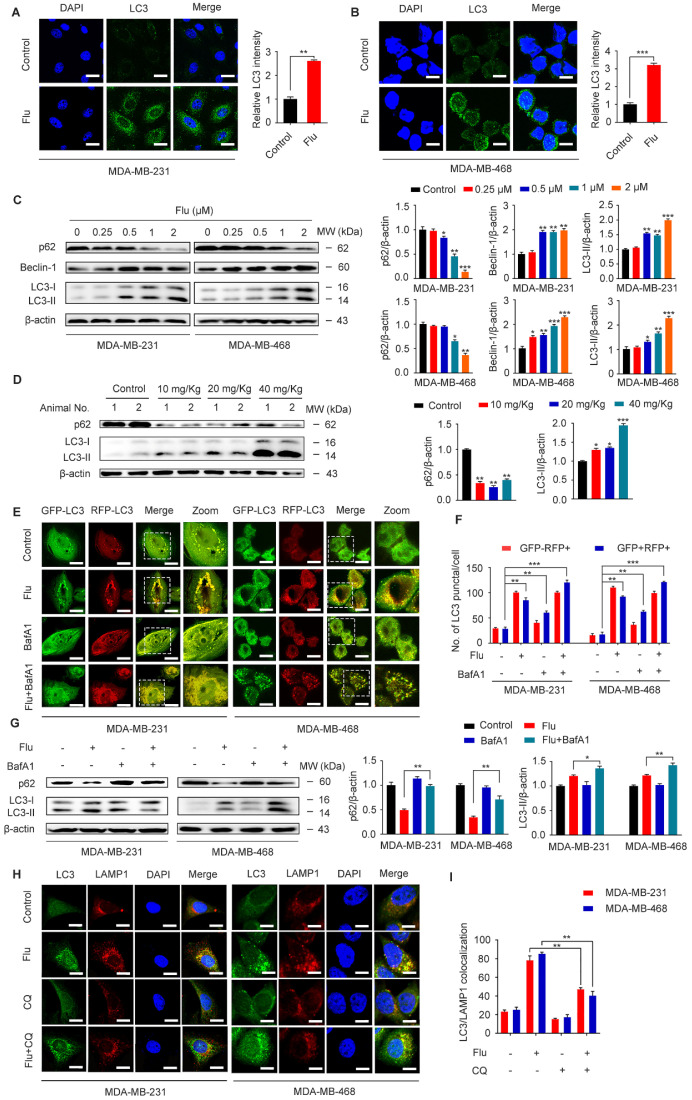
Figure 3.
Flubendazole induces autophagy in TNBC cells. (A-B) Immunofluorescence analysis of the endogenous LC3B puncta in MDA-MB-231 and MDA-MB-468 cells treated with or without flubendazole (0.5 µM) for 24 h. Representative images with quantification of LC3 intensity were shown. Scale bar, 20 µm. (C) Immunoblotting analysis of p62, Beclin-1, LC3 expression in MDA-MB-231 and MDA-MB-468 cells treated with the indicated concentrations of flubendazole for 24 h. β-actin was used as a loading control. Quantification of immunoblotting analysis were shown. (D) Immunoblotting analysis of MDA-MB-231 xenograft tumor tissues from control or flubendazole (20 mg/Kg) treated nude mice for expression of p62 and LC3. β-actin was used as a loading control. Quantification of immunoblotting were shown. (E-F) MDA-MB-231 and MDA-MB-468 cells were transfected with GFP/mRFP-LC3 plasmid, after co-incubation with flubendazole (0.5 µM) in the presence or absence of BafA1 (10 nM). Representative images and quantitative analysis of LC3 puncta were shown. Scale bar, 10 µm. (G) MDA-MB-231 and MDA-MB-468 cells were co-incubated with flubendazole (0.5 µM) in the presence or absence of BafA1 (10 nM), then the expression levels of p62 and LC3 were detected. β-actin was measured as loading control. Quantification of immunoblotting analysis were shown. (H) Immunofluorescence analysis of the colocalization of endogenous LC3 with LAMP1 after treatment of flubendazole (0.5 µM) with or without CQ (10 mM) for 24 h in MDA-MB-231 and MDA-MB-468 cells. Scale bar, 10 µm. (I) The number of colocalized or non-colocalized LC3 and LAMP1 was quantified. Data are expressed as mean ± SEM. All data were representative of at least three independent experiments. *, P < 0.05, **, P < 0.01, ***, P < 0.001. Statistical significance compared with respective control groups.

