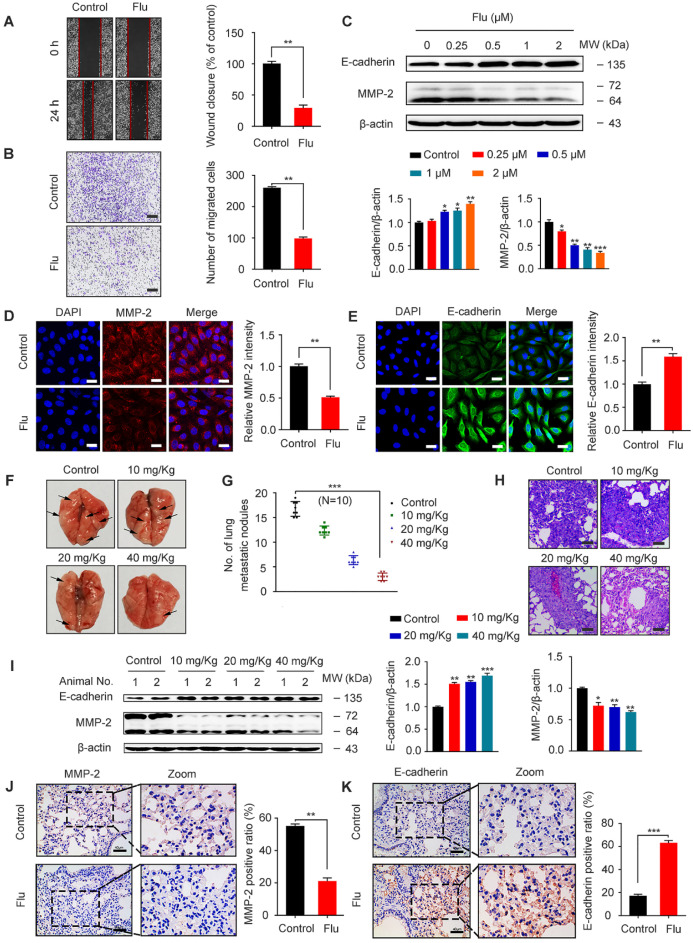
Figure 5.
Flubendazole exerts anti-migration potential in vivo and in vitro. (A-B) MDA-MB-231 cells were treated with or without flubendazole (0.5 µM). The scratch assay and transwell assay were used to measure migration capabilities of the cells. The wound closure ratio represents the level of cell migration ability. Representative images and statistics were shown. Scale bar, 100 µm. (C) Immunoblotting analysis of MMP-2 and E-cadherin expression in MDA-MB-231 cells treated with the indicated concentrations of flubendazole for 24 h. β-actin was measured as a loading control. Quantification of immunoblotting analysis were shown. (D-E) Immunofluorescence analysis of MMP-2 and E-cadherin levels in MDA-MB-231 cells treated with or without flubendazole (0.5 µM) for 24 h. Quantification of immunofluorescence analysis were shown. Scale bar, 20 µm. (F) Representative images of lung metastasis from control or flubendazole treated nude mice, the MDA-MB-231 cells were injected into the vein of mice. The arrow represents pulmonary metastatic nodule. (G) Tumor cell metastasis was examined by counting metastatic nodules in mouse lung. (H) Representative H&E staining of lung sections from control or flubendazole treated nude mice (n = 10). Scale bar, 40 µm. (I) Immunoblotting analysis of MMP-2 and E-cadherin expression in lung tissues from control or flubendazole (20 mg/Kg) treated nude mice. β-actin was measured as a loading control. Quantification of immunoblotting were shown. (J-K) The expression of MMP-2 and E-cadherin in representative lung sections of nude mice from control and median dose (20 mg/Kg). Representative images and quantitative analysis of the percentage of positive ratios were shown. Scale bar, 40 µm. Data are expressed as mean ± SEM. All data were representative of at least three independent experiments. *, P < 0.05, **, P < 0.01, ***, P < 0.001. Statistical significance compared with respective control groups.

